Figures & data
Figure 1. Male C57BL/6 wild type mice with obesity induced by HFD feeding for 12 wks beginning at 6–8 weeks of age, were treated with (black bar) or without (gray bar) EPO (1000U/kg) every 48 hr during the final 2 weeks of the study. Lean mice treated with saline (Lean+Saline; open bar) were used as negative controls. Adipocytes were separated from stromal vascular fraction cells using perigonadal fat, and Mф were purified by FACS from stromal vascular fraction cells using F4/80. Expression of inflammatory cytokine and chemokine genes in adipocytes (A), and Mф (B), were analyzed by qRT-PCR; expression levels are normalized to β-actin, and fold change in expression are relative to negative control Lean+Saline. mRNA levels were quantified. Data represent observations from 3 independent experiments with similar results plotted as mean+SEM for n=4 per group, where statistical significance is *P < 0 .05.
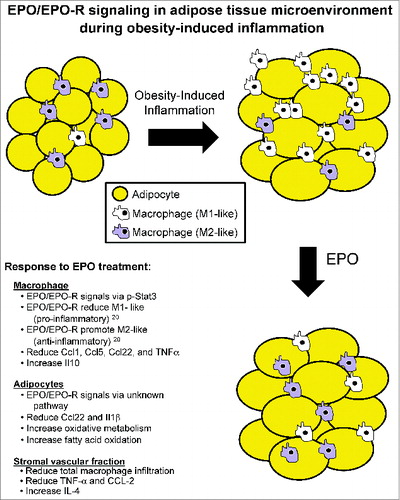
Figure 2. Proposed model for EPO/EPO-R signaling in the adipose tissue microenvironment during obesity-induced inflammation summarizing known EPO effects on i) M1 versus M2-like Mф populations, and ii) cytokine/chemokine gene expression profiles in Mф vs. adipocytes.