Figures & data
Table 1. End of study cumulative food intake, adipose mass, body weight and liver triglyceride and glucose and insulin response (area under the curve; AUC) to glucose tolerance test (GTT) one week before termination
Figure 1. Subcutaneous and visceral adipose tissue percent fatty acid composition of palmitic (16:0) (A), stearic (18:0) (B), oleic (18:1n9) (C) and linoleic (18:2) acid (D). 18:0 was higher in the subcutaneous and visceral adipose depot of the SAT group compared with CON and PUFA. 18:1n9 was also higher in the SAT group. 18:2 was higher in PUFA compared with CON and SAT. (Unlike letters indicate significance; P ≤ 0.05).
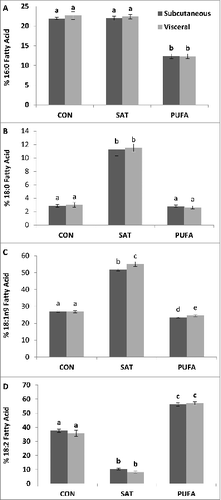
Figure 2. Systemic and portal blood percent fatty acid composition of myristic (14:0) (A), palmitic (16:0) (B), stearic (18:0) (C), palmitoleic (16:1) (D), oleic (18:1n9) (E), linoleic (18:2) (F), and arachidonic acid (20:4) (G). In the SAT group 18:0 and 18:1n-9 were higher whereas 18:2 and 20:4 were lower compared with CON and PUFA. 18:2 was highest in the PUFA group. 14:0 was lower in blood collected from the portal vein compared with systemic blood while 18:1n9 and linoleic acid 18:2 higher the portal vein blood. (Unlike letters indicate significance; P ≤ 0.05).
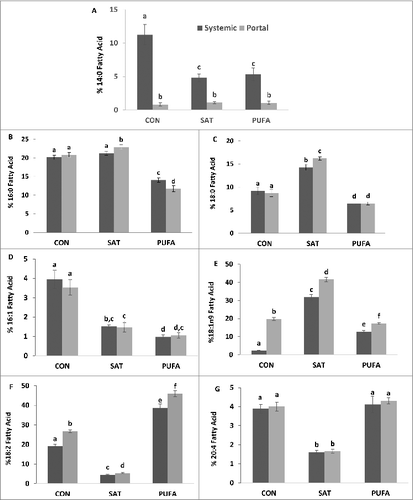
Figure 3. Percent fatty acid composition of liver phospholipids. Stearic (18:0) and oleic acid (18:1n9) were higher and linoleic acid (18:2) lower in SAT compared with CON and PUFA. (Unlike letters indicate significance; P ≤ 0.05).
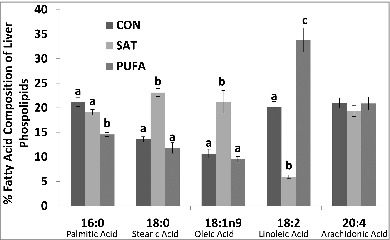
Figure 4. Plasma alanine aminotransferase concentration was higher in SAT compared with CON and PUFA. (Unlike letters indicate significance; P ≤ 0.05).
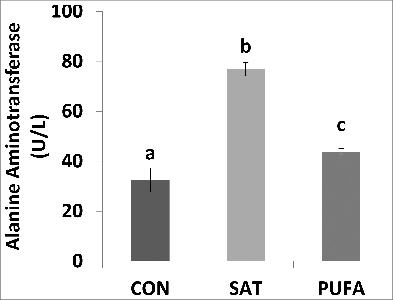
Figure 5. Gene expression of factors involved in liver injury and ER stress. Expression of gene markers of liver fibrosis, α-smooth muscle actin (SMA/Acta2) (A), transforming growth factor-β (Tgfb1) (B), and collagen-α1 (Col1a1) mRNA (C), were higher in SAT compared with CON and PUFA. ER stress markers, spliced X box binding protein-1 (XBP1s), glucose regulated protein 78 (GRP78), C/EBP homologous protein (CHOP), and growth arrest and DNA damage inducible protein 34 (GADD34) were also higher in SAT compared with CON and PUFA. (Unlike letters indicate significance; P ≤ 0.05).
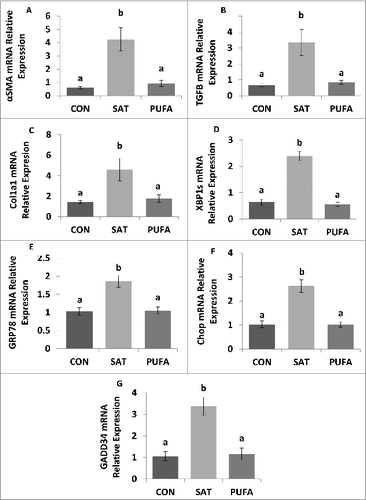
Table 2. mRNA relative expression of genes involved in hepatic lipid metabolism. Acetyl CoA carboxylase (ACC), diacylglycerol transferase (DGAT), fatty acid synthase (FASN), stearoyl-CoA desaturase-1 (SCD1) and sterol regulatory element-binding protein-1c (SREBP)
Figure 6. Gene expression of factors involved in subcutaneous and visceral adipose tissue inflammation and ER stress. C-type lectin domain family 7 member A (Clec7a) and monocyte chemoattractant protein 1 (MCP-1) were higher in visceral compared with subcutaneous adipose tissue (A-B). SAT further increased Clec7a and MCP-1 gene expression in visceral adipose tissue only compared with CON and PUFA. Interleukin 10 (IL10) and spliced X box binding protein-1 (XBP1s) mRNA were higher in subcutaneous compared with visceral adipose tissue (C–D) and SAT further increased IL10 and XBP1s gene expression in the subcutaneous depot only Tumor necrosis factors α (TNFα) and interleukin 6 (IL6) were increased in SAT groups compared with CON, but there were no depot differences (E-F). (Unlike letters indicate significance; P ≤ 0.05).
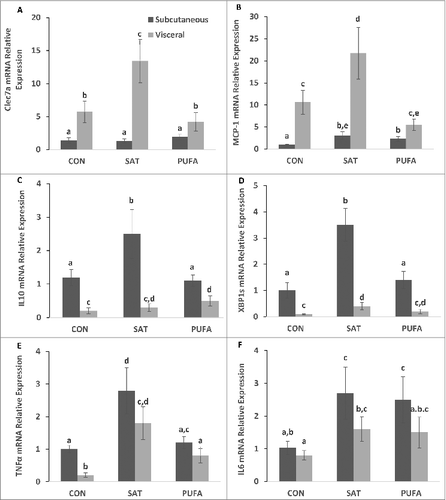
Figure 7. Portal and systemic plasma insulin and adipo/cytokine concentration. PUFA significantly increased portal vein insulin concentration compared with CON and SAT (A). MCP-1 was significantly higher in portal circulation than systemic (B) and PAI was significantly higher in SAT and PUFA than CON (C). (Unlike letters indicate significance; P ≤ 0.05).
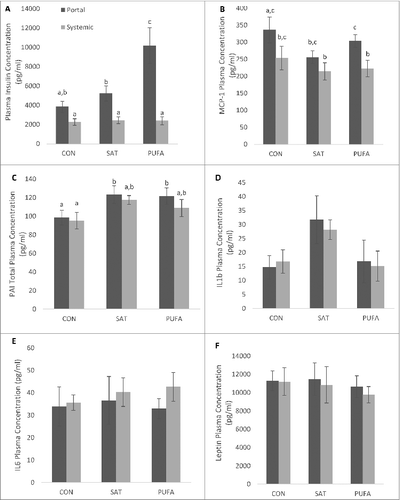
Table 3. Fatty acid composition of experimental diets
Table 4. Sequence of qPCR primers for liver and adipose tissue. Beta-2 microglobulin (B2M), acetyl CoA carboxylase (ACC), α-smooth muscle actin (α SMA), C-type lectin domain family 7 member A (Clec7a), C/EBP homologous protein (CHOP), collagen-α1 (Col1a1), diacylglycerol transferase (DGAT), fatty acid synthase (FASN), growth arrest and DNA damage inducible protein 34 (GADD34), glucose regulated protein 78 (GRP78), interleukin 6 (IL6), interleukin 10 (IL10), monocyte chemotactic protein-1 (MCP-1), stearoyl-CoA desaturase-1 (SCD1), sterol regulatory element-binding protein-1c (SREBP), transforming growth factor-β (Tgfb1), Tumor necrosis factors α (TNFα) and spliced X box binding protein-1 (XBP1s)
