
Figures & data
Figure 1. The effect of incubation temperature on proliferation in primary cultures of pig stromal-vascular cells following treatment for 3 d. Stromal-vascular cells were isolated from porcine adipose tissue, seeded at a concentration of 1.5 × 10³ cells/cm2 in plating medium, and incubated for 24 h at 37°C (designated d −1). Cultures were then continuously exposed to either 37°C or 39°C in plating medium from d 0 to d 3. Cell number was determined in designated plates every 24 h by either directly counting trypsinized cell suspensions (A) or by indirectly determining cell number using the MTT method (B) or via resazurin reduction (C) as described in the Materials and Methods section. Data are means ± SEM from 4 experiments, each performed with cells harvested from a different pig. Twenty-4 replicate wells were assayed within treatment for each pig for each day of incubation. Means within a treatment that do not share a common asterisk differ, P < 0.05.
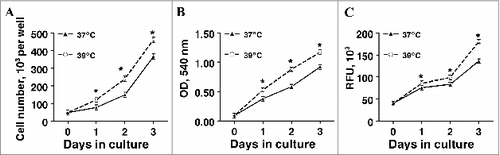
Figure 2. The effect of incubation temperature on glycerol-3-phosphate dehydrogenase (GPDH) activity in primary cultures of differentiating porcine preadipocytes on d 8. Stromal-vascular cells were isolated from porcine adipose tissue, seeded at a concentration of 5 × 10⁴ cells/cm2 in plating medium, and incubated for 24 h at 37°C (designated d −1). Cultures were then continuously treated from d 0 to d 8 with differentiation medium while incubated at either 37°C or 39°C. Cell lysates were harvested after 8 d of treatment and immediately assayed for GPDH activity. Data are means ± SEM from 6 experiments, each performed with cells harvested from a different pig. Three replicate wells were assayed within treatment for each pig. Means within a treatment that do not share a common asterisk differ, P < 0.05.
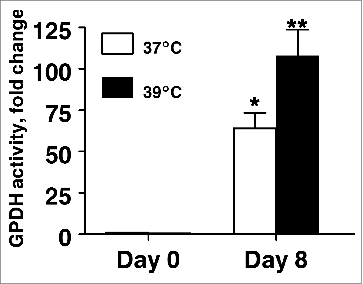
Figure 3. The effect of incubation temperature on the number of lipid-filled adipocytes and accumulation of Oil Red O-stained material (OROSM) present in primary cultures of differentiating porcine preadipocytes on d 8 after induction of differentiation. (A) Stromal-vascular cells were isolated from porcine adipose tissue, seeded at a concentration of 5 × 10⁴ cells/cm2 in plating medium, and incubated for 24 h at 37°C (designated d −1). Differentiating preadipocytes were continuously incubated at either 37°C or 39°C for 8 d after induction. The microscopic magnification was 10× for all images. (B) Stromal-vascular cells were isolated and treated as above. On d 8, plates were stained with Oil Red O, and the extracted stain was quantified spectrophotometrically. The amount of OROSM per well was expressed relative to the protein content of unstained wells receiving similar treatment on the same plate. Data are means ± SEM from 6 experiments, each performed with cells harvested from a different pig.
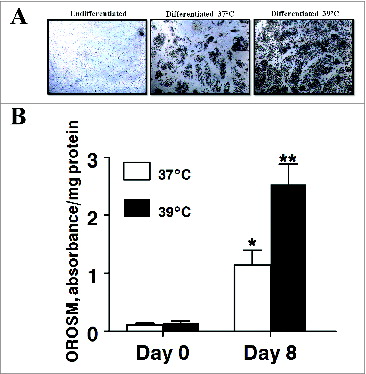
Figure 4. The effect of incubation temperature on mRNA expression in differentiating cultures of primary pig preadipocytes for the transcriptional modulators (A) CCAAT/enhancer-binding protein β (C/EBPβ), (B) CCAAT/enhancer-binding protein α (C/EBPα), (C) peroxisome proliferator-activated receptor gamma (PPARγ), (D) chicken ovalbumin protein transcription factor 1 (COUP-TF1), (E) chicken ovalbumin protein transcription factor 2 (COUP-TF2), and (F) bone morphogenic protein 4 (BMP4). Expression was determined by real-time RT-PCR. Values were normalized to S15 expression. Data is expressed as fold change relative to baseline (d 0) and calculated according to Pfaffl, 2010. Bars denoted by * and ** differ (P < 0.05), n = 6.
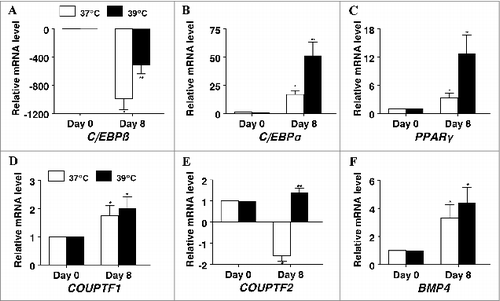
Figure 5. The effect of incubation temperature on mRNA expression in differentiating cultures of primary pig preadipocytes for the adipokines (A) adiponectin, (B) leptin, (C) interleukin-6, and (D) tumor necrosis factor α (TNFα). Expression was determined by real-time RT-PCR. Values were normalized to S15 expression. Data is expressed as fold change relative to baseline (d 0) and calculated according to Pfaffl, 2010. Bars denoted by * and ** differ (P < 0.05), n = 6.
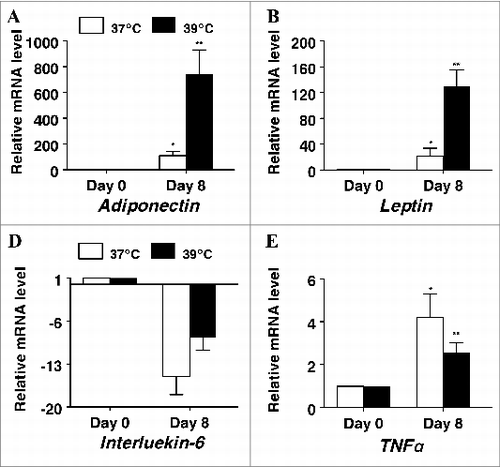
Figure 6. The effect of incubation temperature on mRNA expression in differentiating cultures of primary pig preadipocytes for marker genes (A) carbonic anhydrase III (CA3), (B) flavin containing monooxygenase 1 (FMO1), (C) inter-α (globulin) inhibitor H3 (ITIH3), (D) 6-phosphofructo-2-kinase/fructose-2, 6-biphosphatase 1 (PFKFB1), (E) salivary lipocalin (SAL1), (F) diacylglycerol O-acyltransferase 2 (DGAT2), (G) pleiotrophic factor β (PTFβ), and (H) tenascin-X (TN-X). Expression was determined by real-time RT-PCR. Values were normalized to S15 expression. Data is expressed as fold change relative to baseline (d 0) and calculated according to Pfaffl, 2010. Bars denoted by * and ** differ (P < 0.05), n = 6.
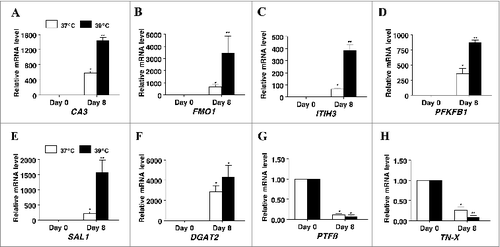
Figure 7. The effect of incubation temperature on markers of adipogenesis in cultures of primary pig preadipocytes differentiated under serum-free conditions. (A) Photomicrographs depict representative cultures on d 0 and 8 after induction of differentiation. The microscopic magnification was 10× for all images. (B) Amount of extractable OROSM dye from stained cultures on d 0 and 8 after induction of differentiation. (C) Glycerol-3-phosphate dehydrogenase (GPDH) activity on d 0 and 8 after induction of differentiation. (D–F) The abundance of peroxisome proliferator-activated receptor gamma (PPARγ), adiponectin, and leptin mRNA on d 0 and 8 after induction of differentiation. Stromal-vascular cells were isolated from porcine adipose tissue, seeded at a concentration of 5 × 10⁴ cells/cm2 in plating medium and incubated at 37°C until cultures reached full confluence. Confluent cultures were then washed in DME/F12 medium and continuously incubated at either 37°C or 39°C for 8 d in serum-free differentiation medium. Expression of mRNA was determined by real-time RT-PCR. Values were normalized to S15 expression. Data is expressed as fold change relative to baseline (d 0) and calculated according to Pfaffl, 2010. Bars denoted by * and ** differ (P < 0.05), n = 6.
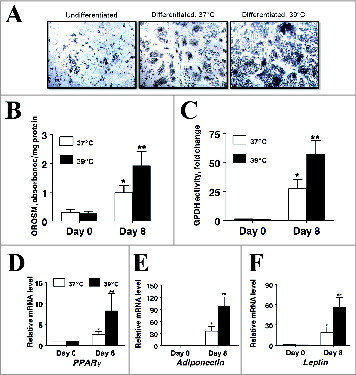
Table 1. Oligonucleotide polymerase chain reaction primers