Figures & data
Figure 1. Conditioned medium from RIP140KD macrophage more effectively induces pre-adipocyte differentiation into beige cells. qPCR detection of mRNA levels of beige markers in cells differentiated from primary preadipocytes cultured with conditioned medium of ATMs isolated from WT or mϕRIP140KD mice. Statistical significance was determined by Student's t-test, with data presented as mean ± SD, *P < 0.05; **P < 0.01; ***P < 0.001.
Figure 2 (See previous page). Experimental design and results of ATM cell therapy. (A) Control PBS or experimental ATMs isolated from minced WAT of mϕRIP140KD mice and labeled with live-dye PKH26 were intraperitoneally (i.p.) injected into HFD-fed WT mice 6 times, at 4 day intervals. After the 6 injections, these mice were assayed for functional GTT, ITT and energy metabolism measurements, then were sacrificed and samples were analyzed. (B) Histological staining of vWAT. (C) Sections of vWAT were analyzed by immunological staining of UCP-1 (green), TMEM26 (green), and co-stained with DAPI (blue). (D) qPCR results of mRNA levels in brown markers in vWAT. (E) qPCR determined mRNA levels of M1 and M2 markers in the SVF of vWAT. (F)-(G) Glucose tolerance test (GTT) and Insulin tolerance test (ITT). (H) Serum insulin, glucose, cholesterol, triglyceride and free fatty acid levels in PBS- or mϕRIP140KD-ATM- (RIP140KD-ATM-) injected wild type (WT) mice. (I) Average body weight of WT mice injected with PBS or RIP140KD-ATM (J) Analyses of energy expenditure of PBS- or RIP140KD-ATM- injected mice, with vO2 consumption measured in both dark and light circadian phases. Statistical significance was determined by Student's t-test, with data presented as mean ± SD, *P < 0.05; **P < 0.01; ***P < 0.001.
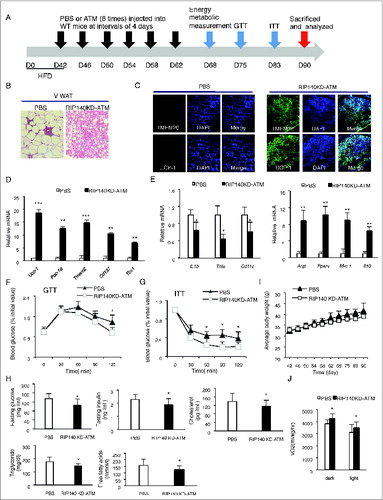
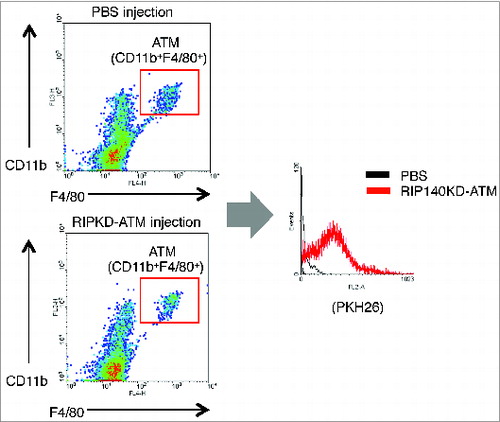
Figure 3. FACS analyses of PKH-26-labeled ATMs incorporation into WAT of injected mice. Left 2 panels show FACS analyses of ATMs collected from animals injected with either control (injection with PBS) or RIP140KD ATMs labeled with PKH-26 label, by gating macrophage specific markers CD11b and F4/80. Right panel shows PKH-26 label in the gated CD11b+F4/80+ ATMs.