Figures & data
Figure 1. CD24 and adipogenic mRNA expression over the course of adipogenesis in 3T3-L1 pre-adipocytes. The mRNA expression of CD24 and known adipogenic genes was determined at the indicated stages of the adipogenesis assay (Prol: proliferating pre-adipocytes; Conf: 100% confluent; Init: 6 h after addition of IBMX + Dex; Prog: 6 h after addition of insulin; Mat: 5 days after addition of insulin). Expression levels of Pref1, Pparγ, Cebpα, Adiponectin and CD24 were determined by RT-qPCR followed by normalization to the internal control gene Rplp0. Relative expression levels are shown with respect to levels in proliferating cells. Data is shown as log2 transformed mean ± s.e.m., n = 3-4. Different lower case letters indicate a significant difference at P < 0.05.
Figure 2. CD24 and adipogenic mRNA expression over the course of adipogenesis in primary cultures from epididymal and inguinal white adipose tissue depots. The mRNA expression of CD24 and known adipogenic genes were determined from pre-adipocytes isolated from visceral epididymal WAT (eSVF) or subcutaneous inguinal WAT (siSVF), at the indicated stages of the adipogenesis assay, as described in . Expression levels of Pref1, Pparγ, Cebpα, Adiponectin and CD24 were determined by RT-qPCR followed by normalization to the internal control gene Rplp0. Relative expression levels are shown with respect to levels in confluent cells. Data is shown as log2 transformed mean ± s.e.m., n = 8. Different letters indicate a significant difference at P < 0.05 (upper case: eSVF, lower case: siSVF).
Figure 3. Total and surface CD24 protein over the course of adipogenesis in 3T3-L1 cells. (A) Total protein expression of CD24 in 3T3-L1 cells was determined by western blot analysis at the indicated stages of adipogenesis (Conf: 100% confluent; I-6 h: 6 h after addition of IBMX + Dex; I-24 h: 24 h after IBMX + Dex addition; Prog: 6 h after addition of insulin; Mat: 5 days after addition of insulin). Actin is used the loading control and the location of molecular mass standards (kDa) are indicated on the right. One representative of 3 independent experiments is shown. (B) Surface CD24 protein expression in 3T3-L1 cells was detected by flow cytometry using anti-CD24-APC or isotype-APC staining control at the indicated stages of adipogenesis, as above (I-20 h: 20 h after IBMX + Dex). All treated samples are compared to a time-matched untreated confluent control. The dashed line indicates the cut-off for CD24-positive vs. negative cells. One representative experiment is shown. (C) Right panel: The relative surface expression of CD24 was calculated relative to the time matched control using mean fluorescence intensity. Left panel: The percent CD24-positive cells were calculated at each time point. Data shown as mean ± s.e.m., n = 6-7. Different lower case letters indicate a significant difference at P < 0.05.
Figure 4. Surface CD24 protein over the course of adipogenesis in primary pre-adipocytes. (A) Surface CD24 protein expression on cells isolated from siSVF was determined by flow cytometry, at select stages of adipogenesis, using the biotinylated anti-CD24 M1/69 antibody. Streptavidin-FITC (Strep-FITC) alone is used as the negative control for staining. One representative experiment is shown. (B) The percent of CD24 + cells from each individual animal (×) and the mean (−) is indicated, n = 4 sets of cells pooled from 2 mice each. Different lower case letters indicate a significant difference at P < 0.05.
Figure 5. cAMP and Dex cooperate to increase CD24 mRNA expression in confluent 3T3-L1 pre-adipocytes. Confluent 3T3-L1 cells were treated for 6 h with 10%FBS/DMEM media alone (control), dexamethasone (Dex), IBMX, IBMX + Dex (I/D), insulin (Ins), Forskolin or the inactive Forskolin analog (iForskolin), as indicated. (A, B, D) CD24 mRNA expression was determined by RT-qPCR and normalized to the internal control Rplp0 and calculated relative to levels in control cells. Data is shown as log2 transformed mean ± s.e.m., n = 4. The fold increase of CD24 by Forskolin over iForskolin is indicated. (C) Intracellular cAMP levels were determined by ELISA. Data shown as mean ± s.e.m., n = 3. nd = not detected in the number of samples indicated in parenthesis. Different lower case letters indicate a significant difference at P < 0.05.
Figure 6. Active transcription, but not de novo protein synthesis, is necessary to induce CD24 expression in response to IBMX + Dex. A-C. Expression of CD24 mRNA was determined by RT-qPCR and were normalized to the internal control Rplp0 and calculated relative to levels in cells treated with DMSO (not shown). (A) Confluent 3T3-L1 cells were treated with actinomycin-D (ActD) for 1 h to inhibit transcription, followed by IBMX + Dex (I/D) 6 h. n = 3-4, (B) Confluent 3T3-L1 cells were treated with I/D for 6 h followed by ActD for 6 h. Data are shown as log2 transformed mean ± s.e.m., n = 3, (C) Confluent 3T3-L1 cells treated with cyclohexamide (CHX) for 1 h, followed by I/D for 6 h. Data are shown as log2 transformed mean ± s.e.m., n = 5. (D) 3T3-L1 cells were transfected with pGL4.17 reporter vector, with or without the indicated CD24 promoter, along with the pRL-SV40 transfection control vector. Cells were stimulated for 24 h as indicated and promoter activity calculated as relative expression of Firefly/Renilla in response to I/D stimulation compared to DMSO treated cells. Data are mean ± s.e.m., n = 3.*P < 0.05.
Figure 7. An increase in CD24 mRNA expression is necessary for adipocyte differentiation. (A) Proliferating 3T3-L1 cells were transfected with scrambled control siRNA or CD24 siRNA, and then induced to undergo adipogenesis as described for . The mRNA expression of CD24 was determined by RT-qPCR when cells were confluent (Conf), 6 h after addition of IBMX + Dex (Init) and 5 days after addition of insulin (Mat). CD24 expression was normalized to the internal control gene Rplp0 and relative expression levels are shown with respect to levels in confluent control siRNA cells. Data shown as log2 transformed mean ± s.e.m., n = 7. (B) Surface CD24 protein expression was determined by flow cytometry in confluent cells (confl), and 20 h after addition of IBMX + Dex (I-20 h). Percent CD24-positive cells are shown as mean ± s.e.m., n = 3. (C) Intracellular lipid was stained with Oil Red O and cells imaged. Scale bar = 200 μm. One representative field of view of 5 independent experiments is shown. (D) Quantification of Oil Red O shown as mean ± s.e.m., n = 4. *P < 0.05, **P < 0.01.
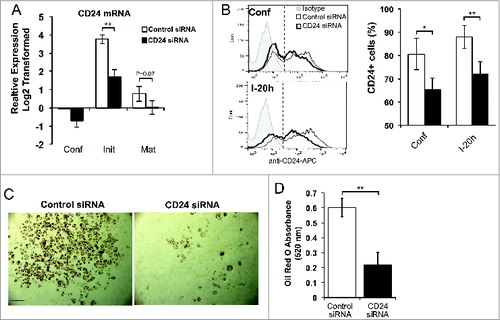
Figure 8. An increase in CD24 mRNA expression is necessary to increase mature adipocyte gene expression and decrease Pref-1 expression. The mRNA expression of Pref1, Pparγ, Cebpα, and Adiponectin was determined from cells that had been transfected with scrambled control siRNA or CD24 siRNA as for . mRNA levels were determined by RT-qPCR when cells were confluent (Conf), 6 h after addition of IBMX + Dex (Init) and 5 days after addition of insulin (Mat) followed by normalization to the internal control gene Rplp0. Relative expression levels are shown with respect to levels in confluent cells. Data shown as log2 transformed mean ± s.e.m., n = 4. *P < 0.05, **P < 0.01.