Figures & data
Figure 1. Patient uveal melanomas are heterogeneous in TCR expression correlating with lymphocytic infiltration. T-cell receptor (TCR) associated transcript expression intensity of uveal melanoma patient samples with tumor-infiltrating lymphocytes (TILs; n = 27) compared to tumors without (n = 30). RNA was extracted from tumor specimens and gene expression profiling performed using Illumina Sentrix 8 BeadChip arrays. Bars represent the mean ± SEM. Statistical analysis was performed using a 2-sided Student's t tests after log transformation and the P-values were adjusted for multiple testing according to the methods of Benjamini and Hochberg. Brackets indicate statistically significant differences between the groups with the P-value indicated above.
Figure 2. Lymphocytes infiltrating uveal melanomas express CD8, FOXP3 and CCL5. (A–C.) Immunohistochemical (IHC) analysis of formalin-fixed paraffin embedded uveal melanoma patient samples for the expression of the indicated marker. Antibody staining was detected using ChromoMap Fast Red chromogenic substrate. Representative results are shown. (A) Example of IHC staining using anti-CD8 antibody at 40 magnification and exhibiting membranous staining. (B) Example of IHC staining using anti-FOXP3 antibody at 40× magnification and exhibiting nuclear staining. (C) Example of IHC using anti-CCL5 antibody at 20 magnification. The red chromogen highlights the cytoplasm of CCL5-positive lymphocytes, which are seen infiltrating the CCL5-negative melanoma cells.
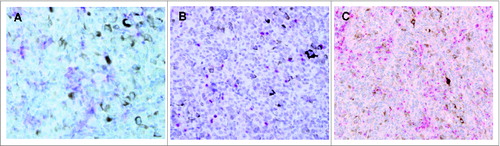
Figure 3. Patient uveal melanomas with and without tumor-infiltrating lymphocytes express similar T helper cell gene expression profiles. (A) T helper (Th) cytokine (A) and Th transcription factor (B) transcript expression intensity of uveal melanomas with tumor-infiltrating lymphocytes (TILs; n = 27) compared to tumors without (n = 30). RNA was extracted from tumor specimens and gene expression profiling performed using Illumina Sentrix 8 BeadChip arrays. Bars represent the mean ± SEM. Statistical analysis was performed using a 2-sided Student's t tests after log transformation and the P-values were adjusted for multiple testing according to the methods of Benjamini and Hochberg. Brackets indicate statistically significant differences between the groups with the P-value indicated above.
Figure 4. Transcriptional analysis of mediators of lymphocyte cytotoxicity in uveal melanoma patient samples. Expression intensity of the transcripts of mediators of lymphocyte cytotoxicity of uveal melanomas with tumor-infiltrating lymphocytes (TILs; n = 27) compared to tumors without (n = 30). RNA was extracted from tumor specimens and gene expression profiling performed using Illumina Sentrix 8 BeadChip arrays. Bars represent the mean ± SEM. Statistical analysis was performed using a 2-sided Student's t tests after log transformation and the P-values were adjusted for multiple testing according to the methods of Benjamini and Hochberg; P-values were >0 .05 for all comparisons.
Figure 5. T cell immune checkpoint molecules and negative regulators are differentially expressed in uveal melanoma tumor specimens. Expression intensity of the transcripts of (A) negative immune regulators, (B) their ligands, and (C) non-classical MHC Class I targets of tumors with tumor-infiltrating lymphocytes (TILs; n = 27) compared to tumors without (n = 30). RNA was extracted from tumor specimens and gene expression profiling performed using Illumina Sentrix 8 BeadChip arrays. Bars represent the mean ± SEM. Statistical analysis was performed using a 2-sided Student's t tests after log transformation and the P-values were adjusted for multiple testing according to the methods of Benjamini and Hochberg; brackets indicate statistically significant differences between the groups with the P-value indicated above.
Table 1. Chemokine and chemokine receptor expression of tumors with and without TILs
Figure 6. CD8A and CCL5 transcriptional correlation in uveal melanoma patient specimens. Spearman rank correlation analysis shows a correlation between CCL5 and CD8A mRNA expression intensity in primary enucleated uveal melanoma patient tumor specimens (n = 57); r value was significant at 0.91.