Figures & data
Figure 1. Dependence on PKC-θ for IL-15 and IFNα-induced NK cell survival and immune function. (A–D) Natural killer (NK) cells derived from C57BL6 mice null for protein kinase C-θ (PKC-θ−/−) vs. wild-type animals (PKC-θ+/+) were functionally characterized for responses to interleukin 15 (IL-15) and interferon-α (IFNα). NK cells were isolated by magnetic cell separation (MACS) technology and cultured in complete medium at 2 × 10⁶ cells/mL in the absence (−) or in the presence of the indicated concentrations of IL-15 or IFNα for 24 h. Afterwards, cells were labeled with an anti-NK1.1 mAb labeled with phycoerythrin (PE) to restrict the cytofluorimetric analysis to NK cells. (A) Cell death was determined by surface staining with Annexin-V labeled with fluorescein isothiocyanate (FITC) and flow cytometry. (B and C) After 24 h cytokine stimulation, NK cells were incubated with YAC-1 cells at a 1:1 ratio during 6h in the presence of monensin and the production of interferon-γ (IFNγ) (B) and degranulation (C) was tested by flow cytometry. IFNγ was detected by intracellular staining with a specific anti-IFNγ antibody labeled with FITC and degranulation was determined by analysis of CD107a surface expression using an anti-CD107a antibody labeled with FITC. (D) The content of granzyme B was analyzed by permeabilization and intracellular staining with a specific anti-granzyme B antibody detected using an FITC-conjugated secondary and flow cytometry. Data are the mean ± SD of 2 independent experiments performed in triplicate; statistical analyses were performed by Student's t test: *P < 0.05; **P < 0.02.
Figure 2. Dependence on PKC-θ for IFNα-induced NK cell immune function in vivo. (A and B) Protein kinase C-θ knockout (PKC-θ−/−) or wild-type (PKC-θ+/+) C57BL/6 mice were injected intraperitoneally with 10,000 IU/mL of interferon-α (IFNα) or the same volume of PBS. After 24 h, mice were sacrificed, and natural killer (NK) cells were magnetically isolated by MACS technology either from total spleen cells or cells derived from flushing the peritoneum. NK cells were functionally characterized following a 6 h stimulation with YAC-1 target cells at a 1:1 ratio, immunofluorescence staining and cytofluorimetric analysis. (A) The degranulation potential of isolated NK cells against YAC-1 cells was estimated using a fluorophore-conjugated anti-CD107a antibody and flow cytometry. (B) The granzyme B content of YAC-1 stimulated NK cells was estimated via immunofluorescence staining and flow cytometry. Data are the mean ± SD of assaying NK cells derived from 3 different mice in each experimental condition; statistical analyses were performed by Student's t test; *P < 0.05; ***P < 0.01; ns: difference not statistically significant.
Figure 3. IFNα-induced PKC-θ activation in NK cells. (A) Natural killer (NK) cells were magnetically isolated by MACS technology from spleens of wild-type (wt) C57BL/6 mice and cultured in complete medium at 2 × 10⁶ cells/mL in the absence (−) or presence (+) of the indicated concentrations of interferon-α (IFNα) for 30 min (left panel), or in the presence of 100 IU/mL of IFNα for the indicated periods of time (right panel). (B and C) Isolated NK cells from wt C57BL/6 mouse spleens were pre-incubated for 30 min in the absence (control) or in the presence of either 10 μM U73122 or 100 nM of wortmannin or rapamycin, as indicated. Afterwards, 100 IU/mL of IFNα were added (+) or not (−) and cells were incubated in the presence of the indicated inhibitors for an additional 30 min. (B) PKC-θ phosphorylation in Ser676 determined by immunoblot. Total PKC-θ and/or β-actin expression was determined in parallel by immunoblot as loading controls. (C) The phospho-PKC-θ/β-actin ratios were determined by densitometry and results expressed as the increase in this ratio. Data shown are the mean ± SD of at least 2 different experiments for each condition.
Figure 4. PKC-θ-dependent transcriptional changes in NK cells induced by IFNα. (A and B) Spleens of wild-type (wt), protein kinase C-θ null heterozygotes (PKC-θ+/−) or knockout (PKC-θ−/−) C57BL/6 mice were used to magnetically (MACS) isolate 10 × 106 natural killer (NK) cells. NK cells from each group were cultured in complete medium for 90 min with or without 100 IU/mL of IFNα, as indicated. RNA was extracted, reverse transcribed and cDNAs amplified via real time qPCR. (A) mRNA expression level of interferon-γ (IFNG) interferon regulatory factor 9 (IRF-9), ISG15 ubiquitin-like modifier (ISG15) or chemokine (C-X-C motif) ligand 10 (CXCL10) as a ratio of the reference RLP1 mRNA level used for standardization. (B) qPCR results from (A) shown as the increase in the ratio of the indicated mRNA level expressed in control cells (untreated) versus cells treated with IFNα. Results are the mean ± SD of duplicate determinations in 2 independent experiments; statistical analyses were performed by Student's t test; *P < 0.05; **P< 0.02; ***P < 0.01; ns: difference not statistically significant.
Figure 5. IFNα-induced STAT1 phosphorylation at Tyr701 in NK cells is independent of PKC-θ. (A and B) Natural killer (NK) cells were isolated by MACS technology from spleens of wild type (PKC-θ+/+) or protein kinase C-θ (PKC-θ−/−) knockout C57BL/6 mice and cultured in complete medium at 2 × 10⁶ cells/mL in the absence or presence of the indicated concentrations of interferon-α (IFNα) for 30 min. Reactions were stopped in the cold, cells lysed, protein extracts prepared and signal transducer and activator of transcription-1 (STAT1) phosphorylation at residue Tyr701 determined by phospho-STAT1 (P-STAT1) specific immunoblot. β-actin expression was determined in parallel as loading control. (B) The phospho-STAT1/β-actin ratios of the experiment shown in (A) were determined by densitometry and represented as a bar diagram. Data shown are representative of 2 independent experiments.
Figure 6. IFNα-mediated STAT-1 phosphorylation on Ser727 is partially dependent upon PKC-θ in NK cells. (A and B) Natural killer (NK) cells were isolated by MACS technology from spleens of wt (PKC-θ+/+) or protein kinase C-θ knockout (PKC-θ−/−) C57BL/6 mice and cultured in complete medium at 2 × 10⁶ cells/mL in the absence (−) or in the presence (+) of 100 IU/mL of IFNα for 30 min. (A) Reactions were stopped in the cold, cells lysed, protein extracts prepared and STAT1 phosphorylation in Ser727 determined by immunoblot. β-actin expression was determined in parallel by immunoblot as loading control. (B) The phospho-STAT1/β-actin ratios were determined by densitometry and results expressed as the increase in this ratio between control cells and cells treated with IFNα in each case. Data shown are the mean ± SD of at least 2 different experiments for each condition.
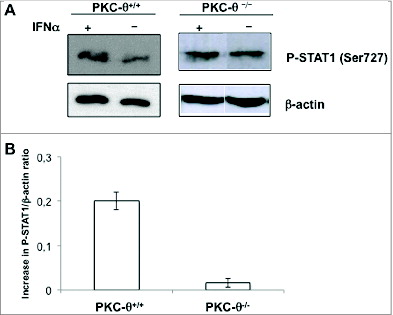
Figure 7. IFNα-induced CXCL10 secretion from NK cells is dependent on PKC-θ. Natural killer (NK) cells were isolated by MACS technology from spleens of wild type (PKC-θ+/+) or protein kinase C-θ knockout (PKC-θ−/−) C57BL/6 mice and cultured in complete medium at 5 × 10⁶ cells/mL in the absence (control) or in the presence (+IFNα) of 100 IU/mL of IFNα for 8 h. After this time, cell culture supernatants were collected and the presence of CXCL10 detected using an ELISA kit. Data are the mean ± SD of 3 different determinations made in duplicate; statistical analyses were performed by Student's t test; *P <0 .05; ***P <0 .01; ns: difference not statistically significant.