Figures & data
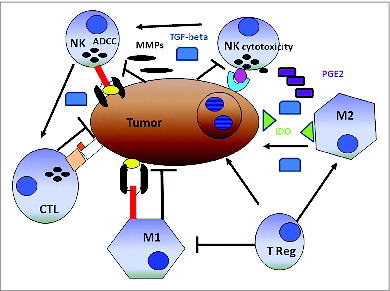
Figure 1. CD56 expression in the colorectal carcinoma microenvironment. Formalin-fixed paraffin-embedded tissue blocks of colorectal cancer (CRC) patient tumor specimens (n = 1410) were sectioned and stained with an anti–CD56 mAb. Following detection with a chromogenic substrate, the brown color shows CD56+ cells. (A) Representative example of CD56− CRC tumor punch with ≤4 CD56+ cells. (B) Representative example of CD56+ CRC patient tumor punch with chains of CD56+ cells >4. (C) IHC analysis detects CD56+ colorectal carcinoma cells.
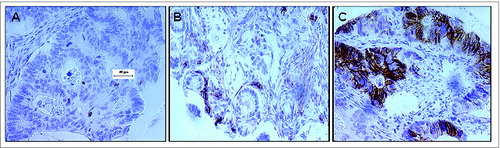
Figure 2. Association of CD8+ T cell and CD56+ natural killer cell infiltration in colorectal tumors with survival. (A—C) Colorectal cancer (CRC) patient samples were analyzed by immunohistochemical analysis to determine the presence of the indicated immune cell phenotypes. Overall survival (OS) is plotted among patients with the indicated immune cell marker profile over time. Statistical analysis was performed by log-rank test. (A) Analysis of CD8 and CD56. “Dotted/dashed” reads “Blue” line: CD56+CD8+ lesions (N = 26), “dashed” reads “red” line: CD56−CD8+ (N = 53), “unbroken” reads “black” line: CD56−CD8− (N = 231), “dotted” reads “green” line: CD56+CD8− (N = 101). (B) Analysis of CD4 and CD56. “Dotted/dashed” reads “Blue” line: CD56+CD4+ (N = 9), “dashed” reads “red” line: CD56−CD4+ (N = 13), “unbroken” reads “black” line: CD56−CD4− (N = 259), “dotted” reads “green” line: CD56+CD4− (N = 117). (C) Analysis of CD3 and CD56. “Dotted/dashed” reads “Blue” line: CD56+CD3+ (N = 89), “dashed” reads “red” line: CD56−CD3+ (N = 170), “unbroken” reads “black” line: CD56−CD3− (N = 96), “dotted” reads “green” line: CD56+CD3− (N = 24).
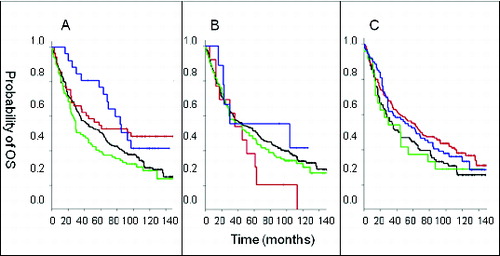
Figure 3. Relationship between CD56 and NKp46 positive cell infiltration in the CRC tumor microenvironment. Fifteen freshly, resected colorectal cancer (CRC) patient tumors were enzymatically digested to a single cell suspension and directly labeled using fluorescence-conjugated antibodies against CD56 and NKp46. CD56+ and NKp46+ cells were detected by cytofluorimetric analysis cytometry in 5 CRC patient specimens. Spearman Rank correlation analysis revealed that the percentage of CD56+ cells significantly correlated with the percentage of NKp46+ cells in the colorectal tumor microenvironment (correlation coefficient, R = 0.97, p = 0.005).
Figure 4. Schematic representation of the alleged relationship between the immune system and solid tumors. Cancer cells cooperating with anti-inflammatory macrophages (M2) contribute to creating an immunosuppressive tumor microenvironment including indoleamine-2,3-dioxygenase (IDO) production, which induces tryptophan depletion and L-kynurenine accumulation (not shown), as well as prostaglandin E2 (PGE2) and transforming growth factor β1 (TGF-β1) accumulation. Tumor cells are also capable of activating tissue matrix metalloproteinases (MMPs), which cleave CD16 from the natural killer (NK) cell surface, reducing their ability to mediate antibody-dependent cellular cytotoxicity (ADCC). T lymphocytes and M1-macrophages are expected to work more efficiently than NK cells in mediating direct cellular cytotoxicity and ADCC, respectively. Both T lymphocytes and M1-macrophages exert indirect antitumor effects through the production of pro-inflammatory cytokines. In this context, NK cells could increase the antitumor activity of cytotoxic CD8+ T lymphocytes (CTLs). Symbols: → = cell activation, ┬ = cell inhibition.