Figures & data
Figure 1. mCPA and sbCPA are equally effective at enhancing tumor control in combination with DPX-R9F peptide vaccine. (A and B). Mice (n = 8) were implanted with C3 tumors on day 0 and treated with 20 mg/kg/day metronomic cyclophosphamide (mCPA) orally starting on day 5 in a one week on/one week off schedule (A) or received a 100 mg/kg single bolus (sbCPA) intravenously one day preceding each vaccination (B). Vaccinations with DepoVax containing 10 μg R9F-PADRE antigen (DPX-R9F) commenced on day 12 and repeated every 3 weeks (days 33 and 54). Results are representative of 2 separate experiments. Eight days after the last vaccination (day 62), mice in remaining groups were terminated and vaccine-draining lymph nodes were collected for immune analysis by interferon γ (IFNγ) ELISPOT assay. (C) Lymph node cells were stimulated with syngeneic dendritic cells unloaded (DC-E) or loaded with R9F peptide (DC-R9F); data are pooled from 2 separate experiments. (D) Lymph node cells were also analyzed for the presence of CD8+ T cells and R9F-specific CD8+ T cells using immunostaining with fluorophore-conjugated anti-CD8 antibody and R9F-dextramer. Data are from one experiment only. Statistical analysis was performed by one-way ANOVA with Tukey's post-hoc test; **P < 0.01, ***P < 0.001.
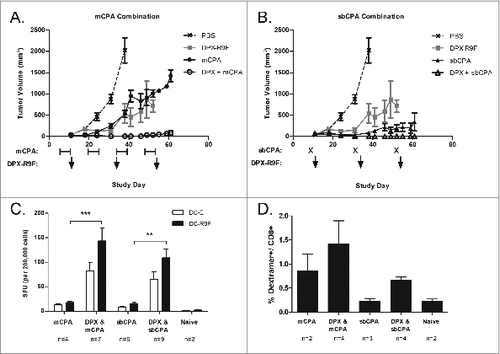
Figure 2. Early vaccination provides optimum immunity and tumor control independently of timing of cyclosphosphamide treatment. (A and B) Mice (n = 10) were implanted with C3 tumors on study day 0. Groups were treated with metronomic cyclophosphamide (mCPA) only, DepoVax vaccine (DPX-R9F) only, a combination of mCPA and vaccine, or PBS as a negative control. All groups were part of the same experiment and were treated in parallel. Treatment commenced one week (day 7; A and B) or 2 weeks (day 15; C and D) after implantation. mCPA was administered every other week for 7 consecutive days and vaccine was given corresponding to the first day of each mCPA treatment (A) or the last day (B). Mice were terminated humanely when tumor size reached 2000 mm3. Statistical analysis of differences in survival were analyzed by log-rank (Mantel-Cox) test, comparing vaccine only with combination therapy; *P <0.05, ****P < 0.0001. (C) Mice (n = 5) were implanted with C3 tumors on day 0 and then vaccinated with DPX-R9F on day 21. mCPA was administered for one week before vaccination (days 14–21) or one week after vaccination (days 21–28). Mice were terminated on day 29 and immune responses of immune cells derived from vaccine draining lymph nodes to dendritic cells loaded with R9F peptide (versus unloaded controls) were assessed by IFNγ ELISPOT assay. Statistical analysis was performed by Student's t-test; *P < 0.05.
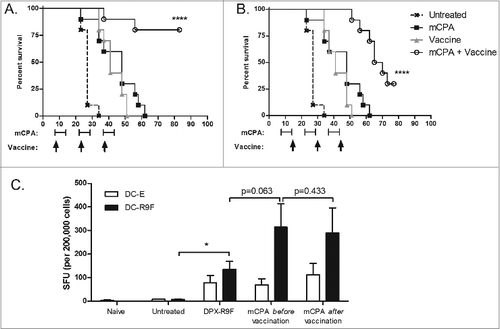
Figure 3. mCPA enhancement of immune response in lymph node due to enrichment of antigen-specific CD8+ T cells. (A) Description of treatment mice used for assays in (B–D). Mice were implanted with C3 tumors on day 0 and then treated with metronomic cyclophosphamide (mCPA) for one week over days 14–21, or DepoVax containing 10 μg R9F-PADRE (DPX-R9F) on day 21, or the combination. Controls included untreated tumor-bearing mice and non-tumor bearing mice treated in parallel. On day 29, 8 d after vaccination, mice were terminated and vaccine-draining lymph nodes were collected. Lymph nodes were dissociated and constituent cells counted (B), used in ELISPOT assay (C) and analyzed by flow cytometry (D). (B) Total lymph node cell counts, n = 12–20. (C) Lymph node cells were stimulated overnight in interferon γ (IFNγ) ELISPOT plate with unloaded dendritic cells (DC-E) or R9F-loaded dendritic cells (DC-R9F); n = 12–20. (D) Immunofluorescent staining of lymph node cells using fluorophore-conjugated anti-CD8 antibody and R9F-dextramers and cytofluorimetric analysis to determine the percentage of CD8+ cells and antigen-specific CD8+ cells; total number of cells calculated from cell counts. Statistical analysis was performed by one-way ANOVA with Tukey post-hoc test; *P < 0.05, **P < 0.01, ***P < 0.001; ND: not detected (lymph nodes too small for analysis). Results are pooled from 5 separate experiments.
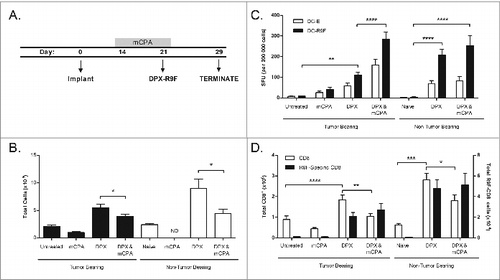
Figure 4. mCPA combined with DPX-R9F vaccination stimulates systemic increase in immune response. (A-C) Spleens were removed from mice treated as in with metronomic cyclophosphamide (mCPA), DepoVax containing 10 μg R9F-PADRE (DPX-R9F), or the combination. (A) Interferon γ (IFNγ) ELISPOT using splenocytes stimulated with R9F peptide or unstimulated (background); n = 23–25; mice pooled from 6 separate experiments. (B) IFNγ ELISPOT using splenocytes stimulated with an irrelevant control peptide or C3 tumor cells; n = 5. (C) Cytotoxic T lymphocyte (CTL) in vivo assay, mice vaccinated with DepoVax containing 5 μg R9F and 5 μg F21E; n = 3–12; mice pooled from 3 separate experiments. Statistical analysis was performed by ANOVA; *P < 0.05, **P < 0.01, ***P < 0.001.
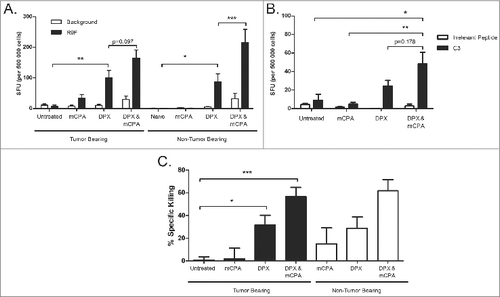
Figure 5. Treatment with mCPA and vaccination increases the intratumoral expression of genes associated with activated cytotoxic T cells. Mice were treated as in with metronomic cyclophosphamide (mCPA), DepoVax containing 10 μg R9F-PADRE (DPX-R9F), or the combination. On day 29, tumors were removed for quantitative RT-PCR analysis and mRNA expression levels determined relative to Tbp (TATA box-binding protein) control. Relative levels of transcript are shown for: (A) CD8α (Cd8a), (B) Granzyme B (Grnb), (C) IFNγ (Ifng), (D) CD4 (Cd4), (E) FoxP3 (Foxp3), (F) IL-10 (Il10), (G) NKG2A (Klrc1), (H) CD19 (Cd19), (I) IL-4 (Il4), (J) PD-1 (Pdcd1), (K) CTLA-4 (Ctla4), (L) VEGF (Vegf). Data shown are the relative expression level in tumors of individual mice (n = 8), with the mean indicated by the bar; results pooled from 2 separate experiments. Statistical analysis was performed by ANOVA with Tukey's multiple comparisons post-hoc test compared to untreated; *P < 0.05, **P < 0.01, ***P < 0.001.
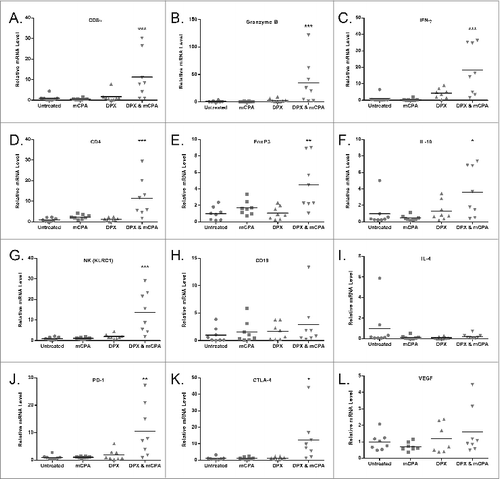
Figure 6. Protective immunity is partially transferred through donor T cells from mCPA and DPX-R9F treated, tumor-bearing mice. (A-D) Donor mice were treated as in with metronomic cyclophosphamide (mCPA), DepoVax containing 10 μg R9F-PADRE (DPX-R9F), or the combination. (A) C3 tumor growth in donor mice until termination. On day 29, donor mice were terminated and spleens and lymph nodes collected and pooled from each group. Total T cells were purified by magnetic separation and injected intravenously into recipient mice which had been implanted with tumors 3 d prior to adoptive transfer. (B) Antigen-specific immune response of donor cells was confirmed by interferon γ (IFNγ) ELISPOT before transfer to recipient mice. Shown are representative data from a single experiment. (C) C3 tumor growth in recipient mice (n = 5–15) transferred (on day 3, indicated with arrow) with total T cells derived from mCPA and DPX-R9F treated, tumor-bearing mice. (D) C3 tumor growth in recipient mice (n = 5–10) that were transferred (on day 3, indicated with arrow) with CD8+ T cells derived from mCPA and DPX-R9F treated, tumor-bearing mice. Results pooled from 2–3 separate experiments. Statistical analysis was performed by 2-way ANOVA with Bonferroni post test of treatment groups versus the PBS control; ***P < 0.001, ****P < 0.0001.
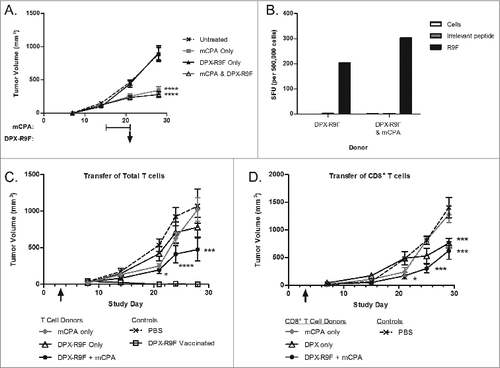
Figure 7. mCPA combined with DPX-R9F vaccination alters the immune cell profile in the spleen. (A-F) C3 tumor-bearing mice (n = 6-8) were treated as in with metronomic cyclophosphamide (mCPA), DepoVax containing 10 μg R9F-PADRE (DPX-R9F), or the combination. On day 25 (4 d after mCPA treatment end), mice were terminated and spleens collected. Total spleen counts (A) were determined and the distribution of splenic immune populations (B-F) quantified by immunofluorescence staining (using the indicated markers) and cytofluorimetric analysis: (A) total splenocytes; (B) total CD8+ T cells (CD8+); (C) total CD4+ T cells (CD4+); (D) total B cells (CD19+); (E) total Treg cells (CD4+/ FoxP3+/ CD25hi); (F) total MDSC (CD11b+/ GR-1hi). Mice were pooled from 2 separate experiments. Statistical analysis was performed by one-way ANOVA with Tukey's post-hoc test; *P < 0.05, **P < 0.01, ***P < 0.001, ****P < 0.0001.
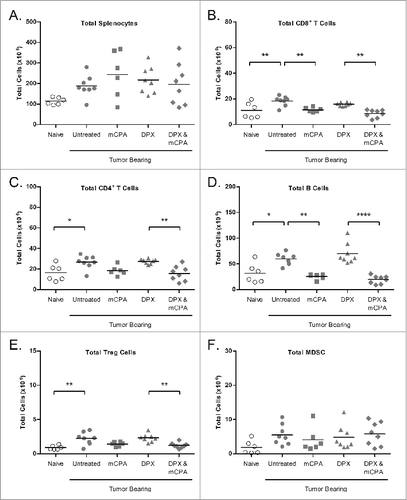
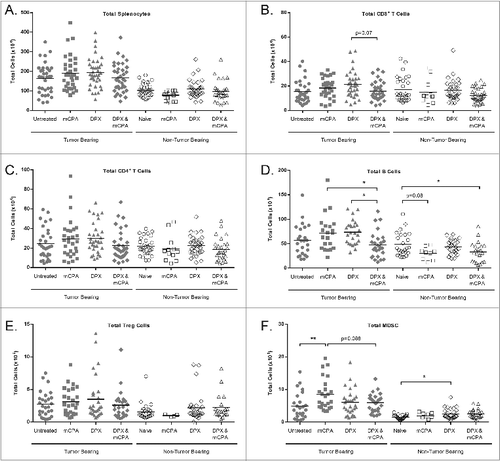
Figure 8. DPX-R9F vaccination attenuates mCPA-induced enrichment of immunosuppressive cells in the spleen. C3 tumor-bearing mice (n = 34–38) were treated as in with metronomic cyclophosphamide (mCPA), DepoVax containing 10 μg R9F-PADRE (DPX-R9F), or the combination. Naïve mice (n = 14–33) without tumor challenge were treated in parallel. On day 29 (8 d after mCPA treatment end), mice were terminated and spleens collected. Total spleen counts (A) were determined and the distribution of splenic immune populations (B-F) quantified by immunofluorescence staining (using the indicated markers) and cytofluorimetric analysis: (A) total splenocytes; (B) total CD8+ T cells (CD8+); (C) total CD4+ T cells (CD4+); (D) total B cells (CD19+); (E) total Treg cells (CD4+/ FoxP3+/ CD25hi); (F) total MDSC (CD11b+/ GR-1hi). Tumor-bearing mice were pooled from 9 separate experiments; non-tumor bearing mice were pooled from 8 separate experiments. Statistical analysis was performed by one-way ANOVA with Tukey's post-hoc test; *P < 0.05, **P < 0.01.