Figures & data
Figure 1. IL-18 enhances mevalonate-derived isoprenoid pyrophosphate-induced upregulation of CD25 expression on Vγ9Vδ2 T cells. Peripheral blood mononuclear cells (PBMCs) at 1.5 × 10⁶/mL were stimulated for 20 h in round-bottom 96-well plate with increasing concentrations of mevalonate-derived isoprenoid pyrophosphates in the absence or presence of 100 ng/mL IL-18 . Cells were stained with fluorophore-conjugated antibodies against CD3, Vδ2 and CD25 (or isotype control). The frequency of CD25+ Vδ2 T cells was assessed via cytofluorimetric analys isusing a FACSCanto II. Data are representative of 2 independent experiments.
Figure 2. Mevalonate-derived isoprenoid pyrophosphates induce proliferation of Vγ9Vδ2 T cells. T cells were isolated and labeled with 0.5 μM carboxyfluorescein diacetate succinimidyl ester (CFSE). CFSE-labeled T cells (1 × 10⁶ cells/mL) were stimulated with 10 μM mevalonate-derived isoprenoid pyrophosphates and 100 U/mL IL-2 in round-bottom 96 wells for 5 days. After staining for Vδ2 using fluorophore-conjugated anti-TCR Vδ2 antibody, cells were analyzed via flow cytometry. Vδ2+ T cells were gated and selectively examined for CFSE dye dilution (stimulated: filled histogram; unstimulated control: open histogram). Data are representative of 3 independent experiments analyzing T cells from 3 different donors.
Figure 3. Cell-extrinsic geranylgeranyl pyrophosphate (GGPP) can restore Vγ9Vδ2 T cell proliferation during statin-mediated mevalonate pathway inhibition. (A) γδ T cells were isolated and stimulated with 10 μg/ml of an anti-Vγ9 antibody plus 100 U/mL IL-2 inducing cell aggregation (scale bar: 500 μm), γδ T cell receptor (TCR) downregulation and γδ T cell expansion. (B) Carboxyfluorescein diacetate succinimidyl ester (CFSE)-labeled γδ T cells were stimulated with an anti-Vγ9 antibody plus 100 U/mL IL-2 and proliferation was inhibited by 2 μg/ml simvastatin (statin). Add-back of 10 μg/ml GGPP partially restored proliferation. Cells were counterstained for CD56 and analyzed by flow cytometry. Data are representative of 3 independent experiments with 2 different donors.
Figure 4. Mevalonate-derived isoprenoid pyrophosphates, IL-18 and N-acetylcysteine (NAC) increased cellular tolerance of Vγ9Vδ2 T cells to H2O2-induced oxidative stress. Peripheral blood mononuclear cells (PBMCs) at 1.5 × 10⁶/mL were seeded in round-bottom 96 wells and treated with 10 μM of the various mevalonate-derived isoprenoid pyrophosphates, 100 ng/mL IL-18 or 100 μM N-acetylcysteine (NAC). Cells were challenged with 10 μM H2O2 for 1 h followed by the addition of 5 μM CellROX Deep Red Reagent for the detection of reactive oxygen species (ROS). After 30 min, cells were washed and cellular fluorescence was determined by flow cytometry. Data are representative of 4 independent experiments with 2 different donors.
Figure 5. IL-18 and N-acetylcysteine enable Vγ9Vδ2 T cell proliferation under severe lymphopenic conditions. (A) Enriched γδ T cells devoid of CD14+ monocytes were obtained from peripheral blood mononuclear cells (PBMCs) using CD14 microbeads and magnetic depletion using LD columns. (B) Photo documentation of cell cultures: enriched γδ T cells were seeded at 103 cells per 96 well and stimulated with 10 μM geranylgeranyl pyrophosphate (GGPP) plus 100 U/mL IL-2 and 100 ng/mL IL-18 in the presence or absence of N-acetylcysteine (NAC). Scale bar: 500 μm. (C) Enriched γδ T cells were seeded in triplicates at 103 cells per 96 well and stimulated with 10 μM mevalonate-derived isoprenoid pyrophosphates plus 100 U/mL IL-2 and NAC in the absence or presence of 100 ng/mL IL-18 . After 14 days, cells were stained with fluorophore-conjugated antibodies CD3 and Vδ2 to confirm γδ T-cell identity. Absolute cell numbers and γδ T-cell expansion were determined by cytofluorimetric analysis (FACS). Data are representative of 4 independent experiments with T cells derived from 4 different donors.
Figure 6. IL-15 converts central memory cells into interferon γ producing effector γδ T cells with a cytotoxic phenotype. (A) Peripheral blood mononuclear cells (PBMCs) at 1.5 × 10⁶/mL were stimulated in round-bottom 96-well plate with 10 μM of the various mevalonate-derived isoprenoid pyrophosphates in the presence of 100 U/mL IL-2 and 100 ng/mL IL-18. After 9 days, cells were stained with fluorophore-conjugated antibodies against CD3, Vδ2, CD45RA and CD27 to determine memory phenotypes. (B) PBMCs depleted of CD14+ cells were cultured with 25 ng/mL IL-15 for the time indicated. Cells were stained with fluorophore-conjugated antibodies against CD3, Vδ2 and CD56 and analyzed by fluorescence cytometry. Vδ2+ T cells were gated on a flow cytometer and selectively analyzed for CD56 expression (filled histogram) vs. isotype control (open histogram). (C) CD14−PBMCs were either freshly analyzed (open histogram) or cultured with 25 ng/mL IL-15 for 4 days prior (filled histogram). Vδ2+ T cells were fixed, permeabilized (as needed) and stained with fluorophore-conjugated antibodies to determine the expression of CD277, IL-15Rα, perforin (intracellular), and CD161 and CD96 (filled histogram) vs. isotype control (dotted line). (D) CD14−PBMCs were cultured with 25 ng/mL IL-15 for 3 days and then stimulated with isopentenyl pyrophosphate (IPP), farnesyl-PP (FPP) or geranylgeranyl-PP (GGPP) for 5 hours. CD56+ cells, which included γδ T cells and natural killer (NK) cells, were gated and analyzed for intracellular interferon γ (IFNγ) and for surface Vδ2. Data are representative of five independent experiments with 3 different donors.
Figure 7. Pyrophosphate antigen stimulated γδ T cells differentiated with IL-15 upregulate surface CD107a and display cytotoxic and anti-proliferative activity against MOLT-4 leukemic cells. (A) Purified γδ T cells were differentiated with 25 ng/mL IL-15 for 4 days, stimulated with isopentenyl pyrophosphate (IPP), farnesyl-PP (FPP) or geranylgeranyl-PP (GGPP) (each at 30 μM) for 4 hours and immunofluorescently stained for surface expression of CD107a in the absence of monensin (filled histogram) vs. isotype control (open histogram). (B) MOLT-4 cells were labeled with 0.5 μM carboxyfluorescein diacetate succinimidyl ester (CFSE) and mixed with IL-15 differentiated γδ T cells (IL-15 γδ T cells) at a ratio of 1:5. The cell mixture was stained with fluorophore-conjugated antibodies against CD3 and TCRVδ2 and analyzed by flow cytometry. In a 96-well round-bottom plate, CFSE-labeled MOLT-4 cells (3 × 10⁴) were co-cultured with 1.5 × 10⁵ IL-15 differentiated γδ T cells (ratio 1:5) that had been pre-activated with pyrophosphate antigens (30 μM) for 4 h. After overnight incubation (in the absence of pyrophosphate antigens), cells were stained for CD3 and TCRVδ2 (as described above) and analyzed by flow cytometry (bottom panel). Data are representative of 3 independent experiments with 2 different donors.
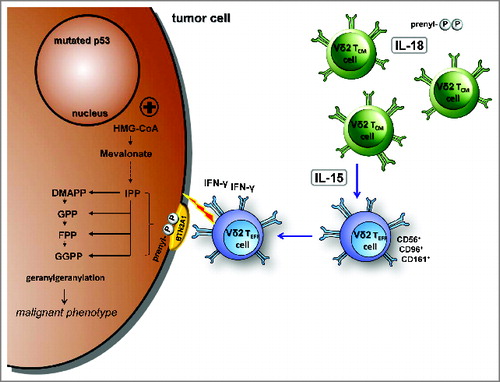
Figure 8. IL-18 and IL-15 regulate γδ T cell surveillance of mevalonate metabolism. IL-18 induces a pre-activated phenotype in γδ T cells, increases immunological responses to antigens as well as tolerance to oxidative stress, and enables proliferation under severe lymphopenic conditions; IL-15 converts central memory Vγ9Vδ2 T cells into effector cells, which produce with innate-like kinetics large amounts of interferon γ (IFNγ) upon antigen stimulation and display potent cytotoxicity against tumor cells.