
Figures & data
Table 1. HLA typings from 10 selected cancer cell lines. HLA Class I (A) and HLA Class II typings (B) as determined by seq2HLA. +HLA I and/or II types (sometimes 2 digits only) reported in literature and confirmed by seq2HLA; ++Ambiguity as 4 digit typing not possible due to scarcity of reads; n.a., no typing possible due to no detectable expression, ‘ambiguity flag
Figure 1. Data integration and computational workflow. Cancer cell line RNA-Seq samples were retrieved from NCBI Sequence Read Archive (SRA) (A), which are input into our bioinformatics software seq2HLA to determine the 4-digit HLA expression (B) and type (C). The cell-line specific HLA types (C) and cell-line specific non-synonymous somatic mutations (D) from mutation repositories, such as Broad-Novartis Cancer Cell Line Encyclopedia (CCLE), were processed with the Immune Epitope Database (IEDB) consensus HLA presentation algorithm to predict high-affinity HLA-presented (antigenic) mutations. The list of predicted HLA-binding mutation epitopes is output (E), containing the HLA allele to which the neo-epitope is predicted to bind and the predicted IC50 value in nanomolar (nM).
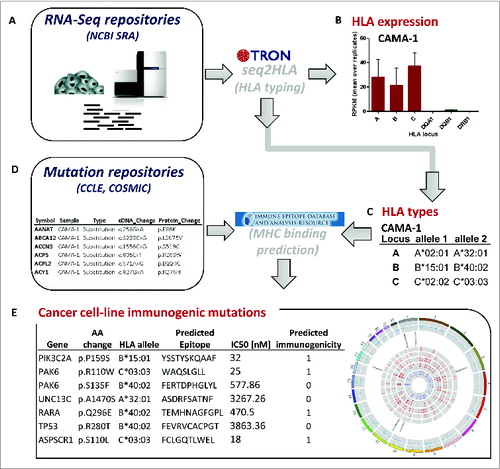
Table 2. Accuracy of 2- and 4-digit typings by seq2HLA from 17 published cell lines. Published HLA types exist for 17 cancer cell lines, comprising 102 possible HLA Class I and 102 possible HLA Class II alleles
Table 3. HLA expression profiles from 10 selected cancer cell lines. Locus-specific HLA Class I and HLA Class II expression profiles determined by seq2HLA in reads per kilobase of exon model per million mapped reads (RPKM). In case of replicate RNA-Seq samples, mean RPKM and standard deviation are indicated
Figure 3. HLA expression profiles of 167 cancer cell lines grouped according to the tissue/disease of origin. The 167 cancer cell lines analyzed in the study are grouped according to their cancer type and each point represents the HLA expression level in one distinct cell line and in cases of replicate RNA-Seq datasets (for 45 cell lines), a point represents the mean expression value of the respective cell line. (red) and SEM (gray) is plotted for HLA Class I (A) and HLA Class II (B). HLA Class I expression is defined as the sum of individual reads for each HLA-A, HLA-B and HLA-C and HLA Class II expression is defined as the sum of individual reads for HLA-DQA1, HLA-DQB1, HLA-DRB1.RPKM, reads per kilobase of exon model per million mapped reads.
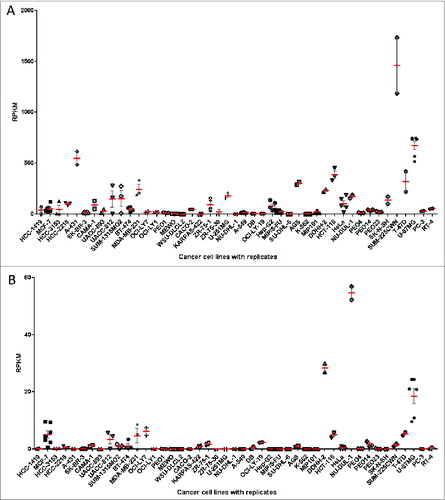
Figure 2. HLA expression levels of replicate cell line RNA-Seq samples. For 45 cancer cell lines, multiple RNA-Seq datasets were available, often from different laboratories. Each point represents HLA expression of one RNA-Seq sample, retrieved from public databases. There is an overall good agreement of HLA Class I (A) and HLA Class II (B) expression levels between those replicate samples. HLA Class I expression is defined as sum of individual reads for each HLA-A,HLA-B and HLA-C and HLA Class II expression is defined as the sum of individual reads for HLA-DQA1, HLA-DQB1, HLA-DRB1. The mean (red) and SEM (gray) are plotted for each cell line with replicate RNA-Seq reads for HLA Class I (A) and HLA Class II (B).
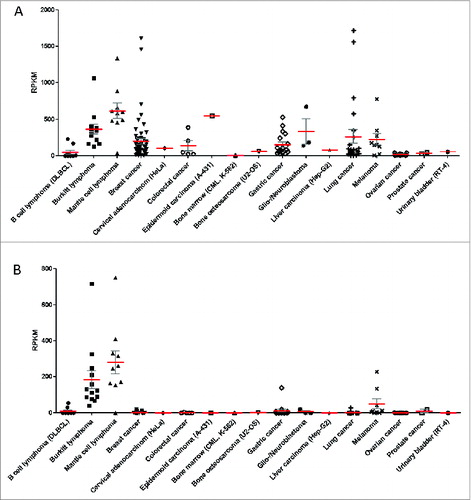
Figure 4. Comparison of HLA expression profiles of cancer cell lines versus primary samples. (A) Analyses from seq2HLA of 13 Burkitt lymphoma cell lines (green) and 28 primary samples (blue) showing comparable HLA Class I and Class II locus specific expression profiles (SRA: SRP009316). Shown are the means (red) and SEM (gray). (B) The glioblastoma cell lines U-251 MG (2 samples), U-87MG (5 replicates) and the neuroblastoma cell line SK-N-SH (2 replicates) - shown in red – HLA Class I expression levels (red; the sum of HLA-A,HLA-B and HLA-C expression) compared to wild-type primary brain samples (blue; SRA:SRR332171 and Illumina body map project with SRA ID ERR030882, one replicate each).
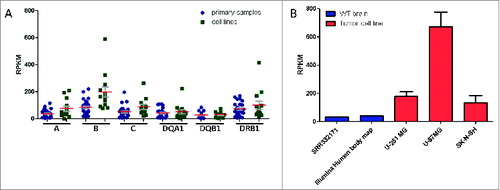
Table 4. Neo-epitope candidate catalog. Shown are example database (source) entries indicating non-synonymous point mutations in known cancer-related genes producing neo-epitopes predicted to bind the respective HLA allele with high affinity (IC50 less or equal than 500 nM) and one example with the greatest in binding (predicted IC50 value of mutated vs wild-type peptide, denoted as Δ)