Figures & data
Table 1. Clinicopathological characteristics and survival data of the 160 patients included in TMA analysis
Table 2A. Expression patterns of IL-6, IL-6R, and pSTAT3 in epithelial tumor tissue and stroma, subdivided by stage and tumor type
Figure 1. Representative staining patterns for (i) immunohistochemistry: (A) tumor core not expressing IL-6 (B) tumor positive for IL-6 (C) Magnification of area with IL-6 producing cells (D) stroma expressing IL-6 (E) low expression of IL-6 receptor (F) medium expression IL-6 receptor (G) high expression of IL-6 receptor (H) negative for pSTAT3 (I) pSTAT3 expressing tumor (J) Magnification quadrangle area of Figure 1I. And (ii) immunofluorescent staining patterns: (K) merged image (L) Magnification quadrangle area of (M) Black and white image (N) CD14 staining pattern (O) CD33 staining pattern (P) CD163 staining pattern.
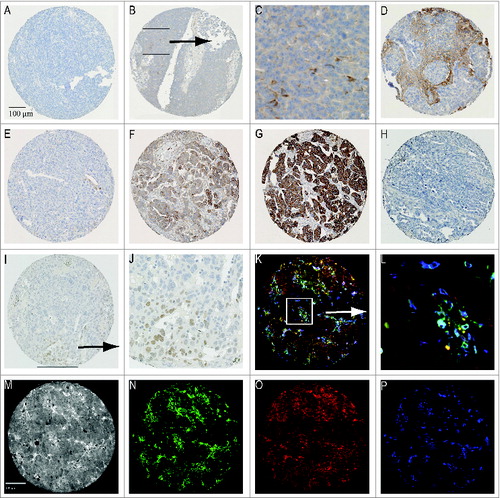
Figure 2. Kaplan–Meier survival analysis for disease-specific survival (DSS), differences between groups were analyzed by Log Rank test. (A) IL-6 expression in tumor epithelium is a predictor of shorter survival (p = 0.034). (B) High expression of the IL-6 receptor in tumor epithelium is associated with a longer DSS (p = 0.010). (C) IL-6R expression analyzed for early and late stage disease. In early stage patients, no difference in DSS was detected for the different expression groups (p = 0.239). In late stage patients, a high expression of the IL-6 receptor in tumor epithelium is associated with a longer DSS (p = 0.045). (D) Patients having a low infiltration of CD33- cells (lowest tertile) show an improved survival (p = 0.017) as compared to patients with a higher infiltration of these cell types. (E) No survival differences were detected when CD33- infiltration was analyzed for DSS in early vs. late stage disease patients.
Table 2B. p-values of correlation markers of IL-6 signaling pathway with myeloid cell populations
Table 2C. Cellular distribution of myeloid cell populations in tumor epithelium and stroma
Table 3. Multivariate Cox regression analyses of disease-specific survival in ovarian cancer patients
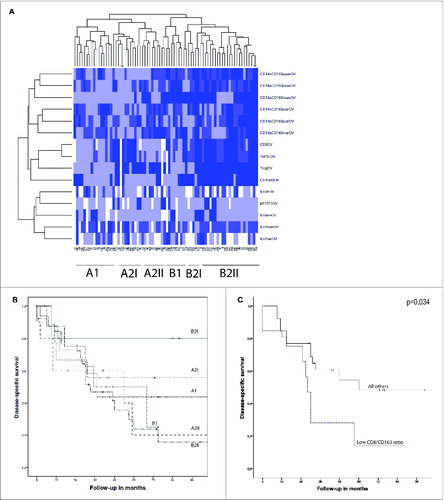
Figure 3. (A) A heatmap was created by unsupervised hierarchal clustering of patients based on all known immunological parameters. Included were lymphoid and myeloid cell populations and markers of the IL-6 signaling pathway. The changes from the lowest to highest tertile are reflected by a darker color, white boxes are missing data. On the X-axis the 76 included patients are depicted, and on the Y-axis all immune parameters are indicated. Each column represents the immune profile of one patient. Brackets to the left and along the top indicate the unsupervised clustering. (B) Kaplan–Meier analysis for the disease-specific survival of the six subgroups as determined by clustering analysis. A significant survival difference was found between groups B2I and B2II (p = 0.039). (C) Kaplan–Meier survival analysis for disease-specific survival of CD8/CD163 ratio lowest tertile vs. all other patients in patients with a high lymphocyte infiltrate (above median). Patients with a low ratio had significant shorter DSS (p = 0.034). Differences were analyzed by Log Rank test.