Figures & data
Figure 1. Treg depletion eradicates some Renca tumors established subcutaneously but not intra-kidney (IK). Mice were inoculated at day 0 with 2 × 10⁵ Renca Ch+ L+ tumor cells subcutaneous (SC) or intra-kidney (IK). All mice were then injected intra-peritoneal (IP), at days 11, 12, 13, with anti-CD4 antibody (αCD4) or isotype control antibody (Ctl) when tumors were established (∼20–30 mm2). (A) Tumor growth, following SC injection, was monitored using a caliper and size was calculated by multiplying the longest diameter by its perpendicular diameter (n = 11–13, representative experiment of 3). (B) Bioluminescence emission imaging was used to monitor Renca Ch+ Luc + IK tumors development following IP injection of D-luciferin. Bioluminescent counts were analyzed from a region of interest applied around mice IK tumors. (n = 9–10, representative experiment of 2). (C) Survival of mice inoculated SC or IK (n = 29–37 per group, 3 experiments pooled). (D and E) Survival of Foxp3DTR mice injected with 2 × 10⁵ Renca cells (D) SC and (E) IK and treated IP with one dose of diphtheria toxin (DT) and PBS as control (Ctl) at (D) day 13 or (E) day 9. (D) (n = 4–6 per group). (E) One experiment (n = 5–7 per group). Statistical analyses of survivals were performed using Log-rank (Mantel–Cox) test ** P < 0.005. *** P < 0.0005.
Figure 2. Treg are depleted in the blood and in tumors following anti-CD4 antibody or diphtheria toxin (DT) injections. Mice were inoculated at day 0 with 2 × 10⁵ Renca Ch+ L+ tumor cells subcutaneous (SC) or intra-kidney (IK) (A–D) Representative FACS analysis of the gating strategy for Treg, and (E and F) quantitative data of percentage of Treg of CD4+ cells analyzed in blood and tumors from (A and C) SC and (B and D) IK tumor-bearing mice. (A, B and E) Wild-type mice were injected with anti-CD4 depleting antibody (CD4 d.) or not depleted as control (Ctl) at days 11, 12, 13 after tumor cell inoculation n = 3 mice per group, from one representative experiment of three. (C and F, SC left panel) Foxp3DTR tumor-bearing mice were injected with DT at day 12 after tumor cells inoculation, n = 4 mice per group, from one experiment. (D and F, IK right panel) Tumor-bearing mice were injected with DT at day 9 after tumor cells inoculation, n = 3 mice per group, from one representative experiment of two. Leukocytes from blood and tumors were analyzed 7 d after last anti-CD4 mAb injection and 2 d (for SC tumors) or 5 d (for IK tumors) after DT injection, by flow cytometry using anti-CD45.2, anti-CD4, anti-T cell receptor (TCR) β, anti-CD25 and anti-Foxp3 antibodies or Foxp3-GFP expression in Foxp3DTR mice. Numbers in the dot plots represent the percentage of cells of total CD4+ cells. Statistical analyses analysis were performed using Mann–Whitney test ** P < 0.005, **** P < 0.0001.
Figure 3. Treg depletion increased the CD8+ T cell effector immune response in subcutaneous (SC) tumors. Mice were injected with 2 × 10⁵ Renca Ch+ L+ SC or intra-kidney (IK) at day 0 and depleted using anti-CD4 antibody (mAb) at days 11, 12, 13 (CD4 d.) or PBS as control (Ctl). CD8+ T cells infiltrating tumors were analyzed, 7 d after the last injection of anti-CD4 mAb, by flow cytometry using anti-CD45.2, anti-T cell receptor (TCR) β, anti-CD8 and anti-interferon (IFN)γ antibodies. Numbers in the dot plots represent the percentage of cells of total CD45.2+ cells. (A) Representative FACS analysis of the gating strategy for IFNγ production in CD8+ T cells infiltrating SC tumors (left panels as depicted) and IK tumors (right panels as depicted). (B–E) Quantitative data of (B) the percentage of TCRβ+/CD8+ T cells of CD45.2+ cells, (c) the percentage of IFNγ+ cells of CD8+ T cells, (D) mean of fluorescence (MFI) for IFNγ on CD8+ T cells, (e) MFI for CD8 surface marker on CD8+ T cells. (n = 3 mice per group, one experiment). Statistical analyses were performed using Mann–Whitney test * P < 0.05, ** P < 0.005, **** P < 0.0001.
Figure 4. CD4+ T cells infiltrating intra-kidney (IK) tumors express more program cell death protein 1 (PD1) then in subcutaneous (SC) tumors. Mice were inoculated at day 0 with 2 × 10⁵ Renca Ch+ L+ SC or IK. CD4+ T cells and regulatory T cells (Treg) infiltrating tumors were analyzed at day 14, by flow cytometry, using anti-CD45.2, anti- TCRβ, anti-CD4, anti-CD25 and anti-Foxp3 antibodies (A and C) Representative FACS analysis and (B and D) quantitative data of percentage of (A and B) CD4+ T cells and (C and D) Treg infiltrating SC and IK tumors and expressing high level of PD1 (determined by the dashed gate-line). (A and C) The gray line histograms represent isotype control antibody staining, the black line histogram represents anti-PD-1 antibody staining. Numbers in the histograms represent the percentage of cells of total CD45.2+ cells. (B and D) (n = 3 mice per group, one experiment). Statistical analyses were performed using Mann–Whitney test *, P < 0.05, **, P < 0.005. (E and F) Day 14 Renca Ch+ L+ SC and IK in vivo tumors were analyzed, by flow cytometry, using the Cherry expression of the tumor cells and anti-CD45.2, anti-PD-L1 antibodies. (e) Representative histograms from FACS analysis and (F) quantitative data of the mean fluorescence intensity (MFI) of PD-L1 on the surface of the tumor cells. (E) The gray curve represents the isotype control and the black curve represents the anti-PD-L1 staining. (n = 2–3 mice per group, one experiment).
Figure 5. Splenocytes from Treg-depleted mice do not exert a strong antitumor immune response in Treg depleted intra-kidney (IK) tumor-bearing recipient mice. Donor mice were injected subcutaneous (SC) with 2 × 10⁵ Renca Ch+ L+ and depleted by anti-CD4 antibody injection at days 11, 12, 13. At day 20, donor mice-spleens were harvested and prepared splenocytes were transferred intravenously (IV), into IK tumor-bearing recipient mice at day 9. After receiving the splenocytes, the IK-tumor-bearing recipient mice were treated with three doses of an anti-CD4 antibody (αCD4) at days 11, 12, 13 or isotype control (Ctl). (A and C) Survival of IK tumor-bearing mice and (B and D) bioluminescence emission imaging of IK tumors from mice transferred with (A and B) 2 × 10⁷ or (C and D) 1.1 × 10⁸ splenocytes. Bioluminescent counts were analyzed from a region of interest applied around mice IK tumors. (A and B) n = 8 mice per group, one experiment. (C) n = 14–15 mice per group, two experiments pooled. (D) n = 8 mice per group, one experiment.
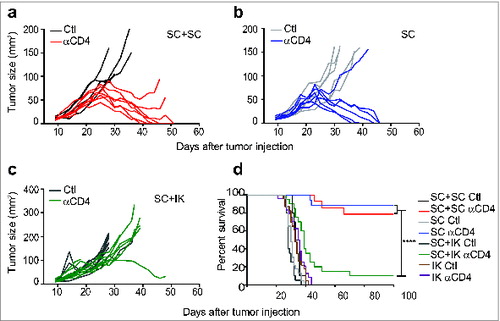
Figure 6. Concomitant intra-kidney (IK) tumors inhibit the response of subcutaneous (SC) tumors to Treg depletion. Mice were injected at day 0 with 2 × 10⁵ Renca Ch+ Luc+ cells in one location: SC or IK, in both locations simultaneously (SC+IK) or two tumors SC (SC+SC). Anti-CD4 antibody (αCD4) or isotype control (Ctl) was administrated at days 11, 12, 13 after tumor inoculation. (A–C) Individual SC tumor growth followed using a caliper and size was calculated by multiplying the longest diameter by its perpendicular diameter. (D) Survival of mice bearing SC and IK tumors in one or two concomitant sites. (A–C) n = 4–9 mice per group, one representative experiment of 2. (D), n = 10–24, three experiments pooled. Statistical analyses of survivals were performed using Log-rank (Mantel–Cox) test **** P < 0.0001.