Figures & data
Figure 1. Mapping patterns of T cell receptor (TCR) cDNA sequences from the CD8+ T lymphocytes of a healthy donor ID001. Deep sequencing of cDNA of TCR α chains (TRA) and β chains (TRB) from ID001 was performed by using Ion Torrent PGM with the 400-bp sequencing kit, and the sequencing reads were analyzed by our novel algorithm of ‘V(D)J decomposition with soft-clipping’. (a) Mapping percentages of constant (C) regions, joint (J) regions, and variable (V) regions in TRA reads > 120bp and TRB reads > 150bp. VdelNum = number of nucleotide deleted in V segment; JdelNum = number of nucleotide deleted in J segment; N = the nucleotides added during VJ rearrangement; N1 = the nucleotides added between VD rearrangement; * in the D indicates the deleted nucleotides during rearrangement; N2 = the nucleotides added between DJ rearrangement. (b) The top 10 TCR V(D)J identified clones of TRA reads (upper panel) and TRB reads (lower panel). (c) The top 10 TCR complementary determining region 3 (CDR3) clones of TRA reads (upper panel) and TRB reads (lower panel). (d) TCR CDR3 length distribution patterns of TRA reads (blue) and TRB reads (red). The x-axis represented the CDR3 length in nucleotide (nt) and the y-axis represented the percentage of each CDR3 length group in all the in-frame CDR3 identified reads without a stop codon.
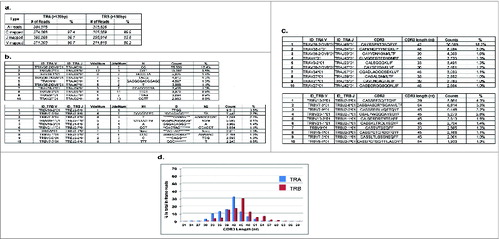
Table 1. Clinical characteristics, outcomes, and CTL responses of five NSCLC patients
Table 2. TCR mapping patterns for NSCLC patients' samples
Figure 2. Quantitative characterization of the most enriched T cell receptor (TCR) clones after cancer therapeutic vaccine treatment in non-small cell lung cancer patient #1. (a) The top 10 V(D)J clones of TRA reads (left panel) and TRB reads (right panel) showing the biggest differences in frequencies between two time points – before treatment (1–1) and after two cycles of vaccination (1–3). (b) The top 10 complementary determining region 3 (CDR3) clones of TRA reads (left panel) and TRB reads (right panel) showing the biggest differences in frequencies between two time points - before treatment (1–1) and after two cycles of vaccination (1–3). NumVdel = number of nucleotide deleted in V segment; NumJdel = number of nucleotide deleted in J segment; Nseq = the nucleotides added between VJ rearrangement; N1 = the nucleotides added between V-D segments; * in the Dseq indicated the deleted nucleotides; N2 = the nucleotides added between D–J segment.
Figure 3. Quantitative characterization of the most enriched T cell receptor (TCR) clones after cancer therapeutic vaccine treatment in non-small cell lung cancer patients #2, #3, #4, and #5. (a) The top five enriched V(D)J and the complementary determining region 3 (CDR3) clones in patient #2 showing the biggest differences in frequencies between two time points – before treatment (2–1) and after two cycles of vaccination (2–3) for TRA (upper panel) and TRB (lower panel). (b) The top five enriched V(D)J and CDR3 clones in patient #3 showing the biggest differences in frequencies between two time points - before treatment (3–1) and after two cycles of vaccination (3–3) for TRA (upper panel) and TRB (lower panel). (c) The top five enriched V(D)J and CDR3 clones in patient #4 showing the biggest differences in frequencies between two time points – before treatment (4–1) and after one cycle of vaccination (4–2) for TRA (upper panel) and TRB (lower panel). (d) The top five enriched V(D)J and CDR3 clones in patient #5 showing the biggest differences in frequencies between two time points – before treatment (5–1) and after three cycles of vaccination (5–4) for TRA (upper panel) and TRB (lower panel). NumVdel = number of nucleotide deleted in V segment; NumJdel = number of nucleotide deleted in J segment; Nseq = the nucleotides added between V–J segments; N1seq = the nucleotides added between V–D segments; * in the Dseq indicated the deleted nucleotides during rearrangement; N2seq = the nucleotides added between D–J segments.
Figure 4. The T cell receptor (TCR) clonal diversity in a healthy donor ID001 and five non-small cell lung cancer (NSCLC) patients who had been treated with cancer therapeutic vaccines. The inverse Simpson's indexes of V(D)J clones (upper panel) and the complementary determining region 3 (CDR 3) clones (lower panels) were calculated as a measurement for TCR clonal diversity (O = TRA, ▴= TRB).
Figure 5. The T cell receptor (TCR) complementary determining region 3 (CDR3) length distribution patterns in five non-small cell lung cancer (NSCLC) patients who had been treated with cancer therapeutic vaccines. The x-axis represented the CDR3 length in nucleotide (nt) and the y-axis represented the percentage of each CDR3 length group in all the in-frame CDR3 identified reads without a stop codon (TRA groups in blue and TRB groups in red). TCR CDR3 length distribution patterns in patient #1 (a), patient #2 (b), patient #3 (c), patient #4 (d), and patient #5 (e) were presented.
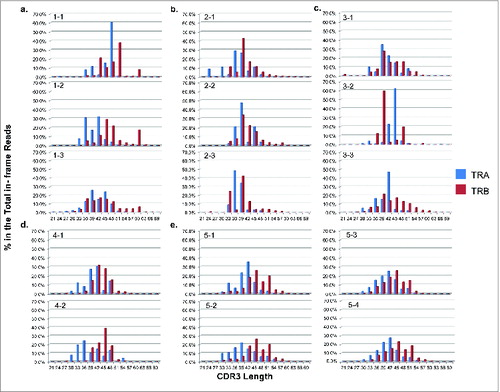
Figure 6. The analysis of unmapped T cell receptor β chains (TRB) cDNA reads from five non-small cell lung cancer (NSCLC) patients who had been treated with cancer therapeutic vaccines. TRB reads containing identified J and C segments and the unmapped part of at least 20bp were extracted, termed as “unmapped-J-C > 20bp reads”, and then attempted to assign to the genomic reference sequences. (a) The classification of TRB unmapped-J–C > 20bp reads. Two major groups (a intronic group and a non-intronic group) and four subgroups (subgroup 1: J Intron, subgroup 2: D Intron, subgroup 3: Other reference, subgroup 4: Unmapped) were identified. (b) The proportions of individual groups in the total TRB unmapped-J-C > 20bp reads (two major groups in the upper panel; four subgroups in the lower panel).
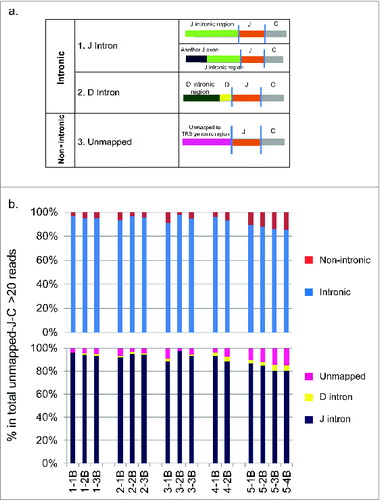
Figure 7. The biased J segment usage in those unmapped T cell receptor β chains (TRB) cDNA reads from five non-small cell lung cancer (NSCLC) patients who had been treated with cancer therapeutic vaccines. Analysis was performed on the TRB reads containing identified J and C segments but not V segments, known as “unmapped-J–C reads”.
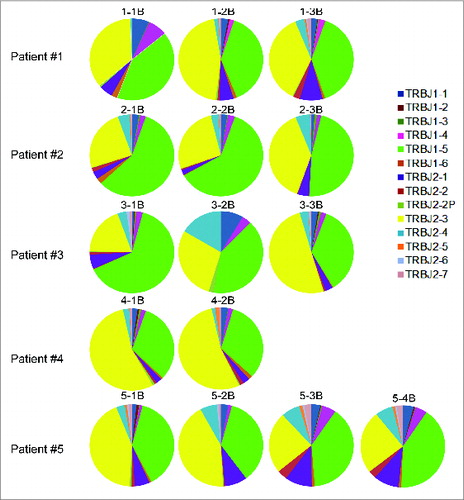
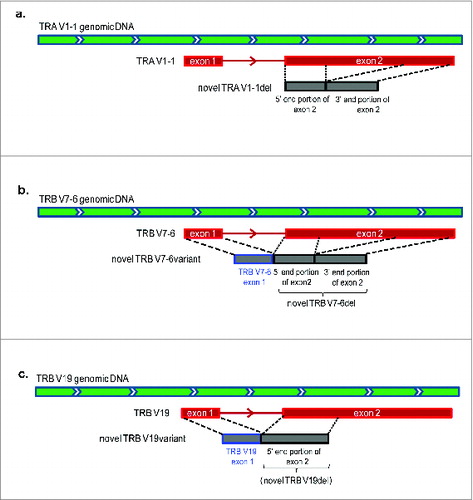
Figure 8. The structures of potentially novel T cell receptor (TCR) V segment exons. (a) A potentially novel TRA V1–1 exon. (b) A potentially novel TRB V7–6 exon. (c) A potentially novel TRB V19 exon.