
Figures & data
Figure 1. IFN-γ production in primary mononuclear cell cultures challenged with Phytohaemaglutinin (PHA), Purified Protein Derivative (PPD) and M. bovis BCG. In the left panel, ELISPOT assay results for representative healthy adult mononuclear (A and B) and neonate cord blood cells (C and D) are shown. The corresponding production levels in terms of counts of spot forming colonies are described below. PHA, PPD and BCG antigens were used at concentrations of 1% and 5 μg/ml, respectively. In the right panel, the average productions (± SEM) for healthy adult mononuclear (HD) and neonate cord blood cells (UV) are shown.
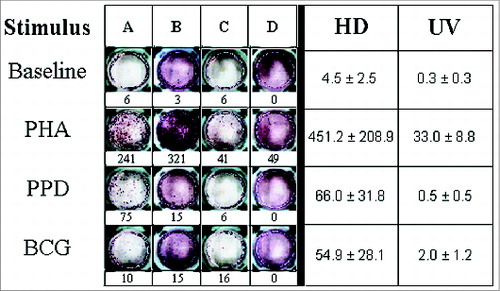
Figure 2. Cytokine productions induced by BCG Moreau infection at 48 h in PBMCs from healthy donor (HD) and CBMCs from umbilical vein (UV) individuals. Shown are levels of (A) IL-2, (B) IFN-γ, (C) TNF-α and (D) IL-10 in (pg/mL). Bars depict the mean levels in each condition. *P < 0.05; **P < 0.01.
Figure 3. Treg cells, PD-1 and CD25-activation markers induced by BCG Moreau at 48h in T cells from healthy donor (HD) and umbilical vein (UV) individuals. Bars depict the mean levels in each condition. *P ≤ 0.05; **P < 0.01. Insert shows a typical profile from one representative experiment for PD-1 and CD4 double staining for (A) baseline and (B) BCG Moreau-infected PBMC cultures evaluated by flow cytometry. In the dot plot, percentages of cells are indicated in each quadrant. The viable lymphocyte population was previously gated on the basis of their light scattering properties. FL-1 and FL-8 represent CD4 FITC and PD-1 APC staining, respectively.
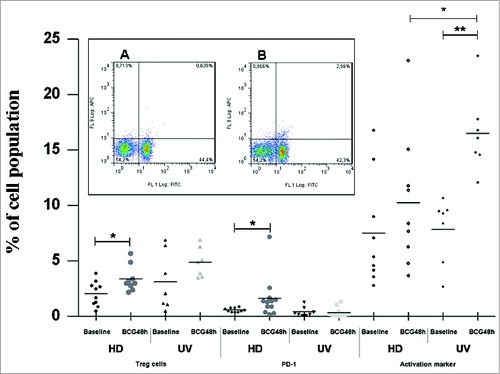
Figure 4. (A) Transforming growth factor (TGF)-β1 levels in pg/mL measured by ELISA in the supernatants of PBMCs from healthy donor (HD) and CBMCs from umbilical vein (UV) individuals stimulated with BCG Moreau for 48h. Horizontal bars represent mean values in each condition. (B) Tr1 cells (CD4+IL-10+FOXP3+; open bars) and monocytes+IL-10+ (black bars) induced by BCG Moreau at 48 h in PBMC from healthy donor. Bars depict the mean levels (+ SEM) in each condition. **P < 0.01.