Figures & data
Figure 1. Vaccination with several TUMAPs simultaneously triggers a broad immune attack against the tumor.
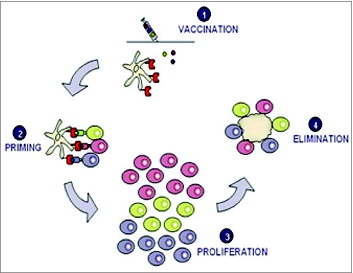
Figure 2. Selection, Identification and Validation of TUMAPs.
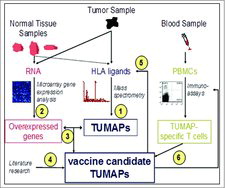
Table 1. Summary of peptide selection
Table 2. Vaccination schedule in IMA901–101Citation59
Figure 3. Local injection site reactions i.e., erythema, induration, edema, itching and pain 5 minutes and 24 hours post vaccination and about 1 month after last vaccination. (Safety population; N = 30).
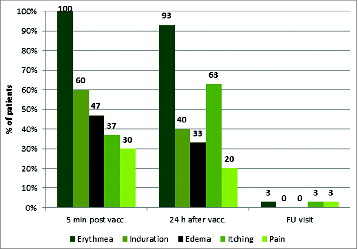
Figure 4. Waterfall plot and vaccine-induced T-cell responses as indicated by the TUMAPs named above the bar representing the percentage of change in longest diameter of target lesions. The occurrence of new lesions is outlined and patients without measurable disease according to RECIST at baseline are marked with a shadow around the zero. Patient numbers and the treatment line of the vaccination therapy are illustrated.
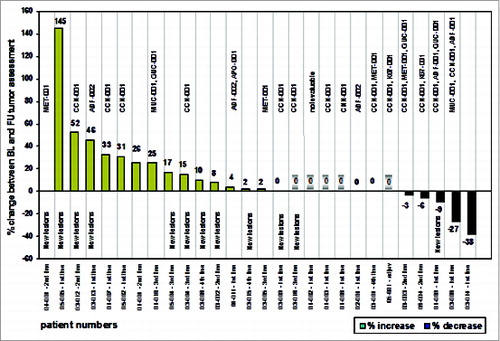
Figure 5. Association between vaccine-induced T-cell responses and clinical benefit defined as responding or stable disease after 3 months of vaccination (at the follow up visit). The clinical benefit rates were 14%, 33% and 75% for patients with 0, 1 and ≥ 2 TUMAP responses, respectively. 38% of Non-HBV responders and 47% of HBV responders had their disease controlled at the follow up visit.
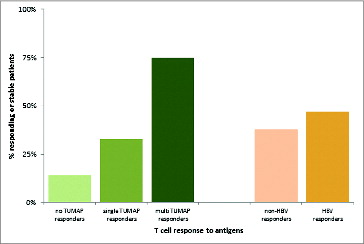
Figure 6. Association between pre-vaccination Treg frequency and number of induced TUMAP responses (n = 26). Lower pre-vaccination frequencies of Treg cells defined as CD4+Foxp3+ cells among CD45+ lymphocytes (y axis) were associated with the induction of multiple IMA901 TUMAP responses (x axis). Every dot represents one patient and horizontal lines illustrate the median Treg frequencies.
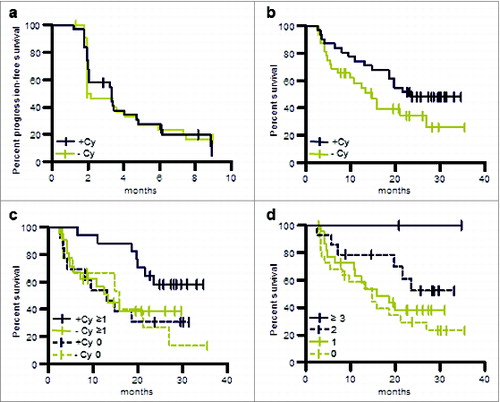
Figure 7. OS and PFS of patients treated in the phase II study (per protocol population). (a) PFS of patients pre-treated with cyclophosphamide or without such pre-treatment. (b) OS of patients pre-treated with cyclophosphamide or without such pre-treatment. (c) OS of patients evaluable for immune responses in the following groups: immune responders pre-treated with cyclophosphamide, +Cy ≥ 1; patients pre-treated with cyclophosphamide for whom no immune response was observed, +Cy 0; immune responders without cyclophosphamide pre-treatment, −Cy ≥ 1; patients without cyclophosphamide pre-treatment for whom no immune response was observed, −Cy 0. (d) OS of patients for whom no immune response was observed, immune responders to one TUMAP, immune responders to 2 TUMAPs or immune responders to at least 3 TUMAPs.