1,006
Views
2
CrossRef citations to date
0
Altmetric
Research Paper

A comparative study of two different assay kits for the detection of secreted alkaline phosphatase in HPV antibody neutralization assays

, , , &
Pages 337-346 | Received 21 Jul 2014, Accepted 02 Oct 2014, Published online: 31 Mar 2015

Figures & data

Table 1. Comparison of different chemiluminescence-based SEAP assay kits

Figure 1. ZiVa can better detect SEAP than GE. Pseudovirion particles of HPV types 16 and 18 were serially diluted, and used to infect 0.03 × 10⁶ 293TT cells. Two-fold serial dilutions were performed starting from 1:1000 to 1:1024000. Supernatants were harvested at 48 and 72 hr post-infection. Each PsV dilution was setup in duplicate wells. Mean ± standard deviation (SD) of 3 independent experiments are shown. (A) Infectivity levels (fold-increase) by PsV16 particles after 48 or 72 hr of incubation are shown. (B) Infectivity levels by PsV18 particles after 48 or 72 hr of incubation are shown. In both (A and B), the same supernatant samples were tested using ZiVa or GE SEAP detection kit. The plots show fold-increase in log10 scale as a function of viral concentration (log10). Some of the error bars are too small to be seen in the graphs.
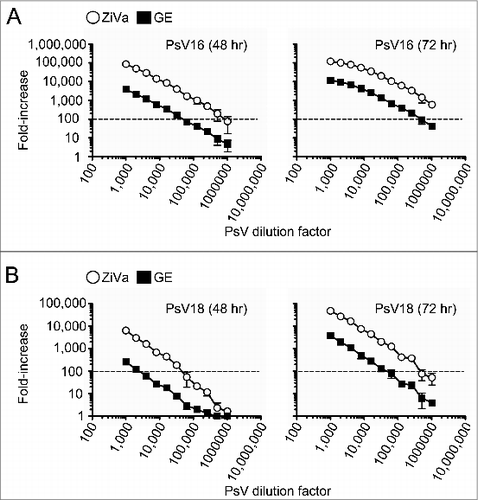
Figure 1. ZiVa can better detect SEAP than GE. Pseudovirion particles of HPV types 16 and 18 were serially diluted, and used to infect 0.03 × 10⁶ 293TT cells. Two-fold serial dilutions were performed starting from 1:1000 to 1:1024000. Supernatants were harvested at 48 and 72 hr post-infection. Each PsV dilution was setup in duplicate wells. Mean ± standard deviation (SD) of 3 independent experiments are shown. (A) Infectivity levels (fold-increase) by PsV16 particles after 48 or 72 hr of incubation are shown. (B) Infectivity levels by PsV18 particles after 48 or 72 hr of incubation are shown. In both (A and B), the same supernatant samples were tested using ZiVa or GE SEAP detection kit. The plots show fold-increase in log10 scale as a function of viral concentration (log10). Some of the error bars are too small to be seen in the graphs.

Table 2. Ratios of ZiVa to GE in detecting SEAP

Figure 2. ZiVa can detect SEAP even using limiting numbers of 293TT cells. Different numbers of 293TT cells were plated at the start of the infections by PsV16 or PsV18. The number of cells ranged from 0.002 - 0.3 × 10⁶ cells per well, and 2-fold serial dilutions were performed. Each cell number was tested in triplicates. A fixed dilution factor of 1:100000 for PsV16 (A) and 1:10000 for PsV18 (B) were used to infect 293TT cells. At 48 or 72 hr post-infection, the supernatants were harvested. Cell numbers were plotted in log10 scale. Mean ± SD of 3 independent experiments are shown. Some of the error bars are too small to be seen in the graphs.
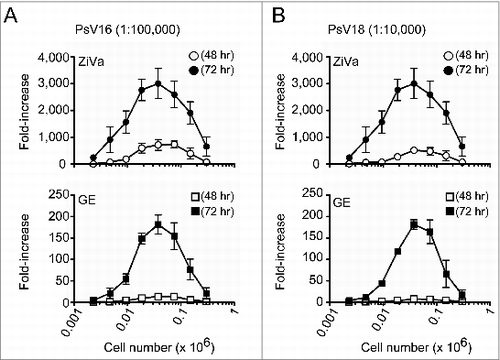
Figure 2. ZiVa can detect SEAP even using limiting numbers of 293TT cells. Different numbers of 293TT cells were plated at the start of the infections by PsV16 or PsV18. The number of cells ranged from 0.002 - 0.3 × 10⁶ cells per well, and 2-fold serial dilutions were performed. Each cell number was tested in triplicates. A fixed dilution factor of 1:100000 for PsV16 (A) and 1:10000 for PsV18 (B) were used to infect 293TT cells. At 48 or 72 hr post-infection, the supernatants were harvested. Cell numbers were plotted in log10 scale. Mean ± SD of 3 independent experiments are shown. Some of the error bars are too small to be seen in the graphs.
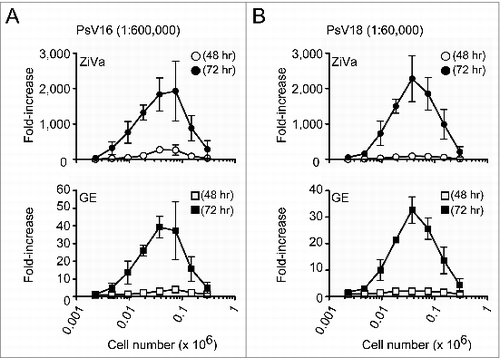
Figure 3. ZiVa can detect SEAP at lower cell numbers using lower viral dilution concentrations. The experiments were conducted as described in , except higher viral dilution factors were used: 1:600000 for PsV16 and 1:60000 for PsV18. Mean ± SD of 3 independent experiments are shown. Some of the error bars are too small to be seen in the graphs.

Figure 3. ZiVa can detect SEAP at lower cell numbers using lower viral dilution concentrations. The experiments were conducted as described in Fig. 2, except higher viral dilution factors were used: 1:600000 for PsV16 and 1:60000 for PsV18. Mean ± SD of 3 independent experiments are shown. Some of the error bars are too small to be seen in the graphs.

Table 3. Comparison of 50% neutralization titer values measured by GE or ZiVa

Figure 4. HPV neutralizing antibody titers measured by ZiVa correlate with those of GE. Cell-culture supernatants from 293TT cell-based neutralization assay from the Uganda Immunogenicity Study were used to quantitate 50% neutralization titers in sera of Cervarix®-immunized individuals using ZiVa or GE. The supernatant samples collected after 72 hr of incubation were used to measure the SEAP activity. Spearman rank-correlational analyses were performed between the titers obtained by ZiVa or GE for both anti-HPV16 and -HPV18 antibodies.
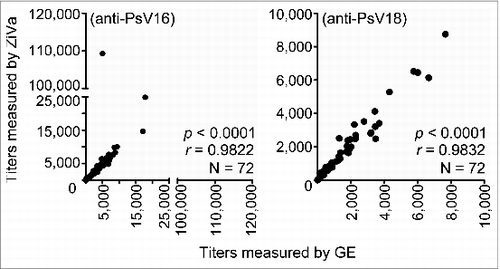
Figure 4. HPV neutralizing antibody titers measured by ZiVa correlate with those of GE. Cell-culture supernatants from 293TT cell-based neutralization assay from the Uganda Immunogenicity Study were used to quantitate 50% neutralization titers in sera of Cervarix®-immunized individuals using ZiVa or GE. The supernatant samples collected after 72 hr of incubation were used to measure the SEAP activity. Spearman rank-correlational analyses were performed between the titers obtained by ZiVa or GE for both anti-HPV16 and -HPV18 antibodies.
Supplemental material

Supplementary_Tables.docx

Download MS Word (28.6 KB)

Reprints and Corporate Permissions

Please note: Selecting permissions does not provide access to the full text of the article, please see our help page How do I view content?

To request a reprint or corporate permissions for this article, please click on the relevant link below:

Academic Permissions

Please note: Selecting permissions does not provide access to the full text of the article, please see our help page How do I view content?

Obtain permissions instantly via Rightslink by clicking on the button below:

If you are unable to obtain permissions via Rightslink, please complete and submit this Permissions form. For more information, please visit our Permissions help page.