Figures & data
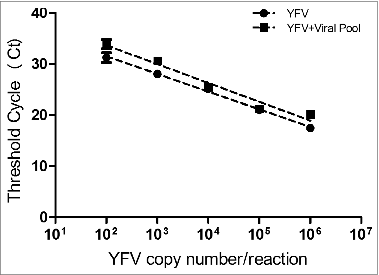
Figure 1. Comparative analysis of Ct values generated by distinct concentrations of recombinant plasmid containing the 83 bp fragment from the NS5 region of the 17DD yellow fever virus (YFV) diluted in negative human serum (YFV standard curve) and in serum containing together Mumps virus, Dengue 1, 2 and 3 and Measles (YFV standard curve + viral pool).

Table 1. Specificity analysis of the Yellow Fever Virus RT-qPCR
Table 2. Linearity between the number of plasmid copies/reaction and Ct values to estimate the limits of detection and quantification for the Yellow Fever Virus RT-qPCR
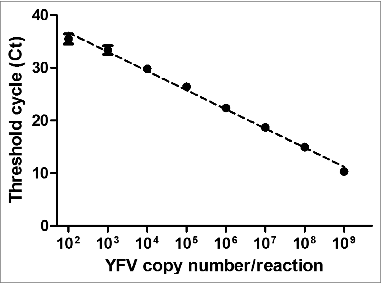
Figure 2. Reportable amplification range to evaluate the performance of the TaqMan YFV RT-qPCR. The standard curve parameters were: slope = - 3.68; intercept = 45.08; coefficient of determination (r2) = 0.99 and amplification efficiency (E) = 86.2 %. Each point of the curve was tested in 8 replicates in the same run.

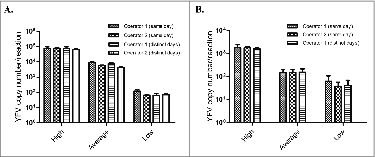
Figure 3. Precision evaluation of the YFV RT-qPCR. (A) Reconstituted serological samples spiked with purified 17DD-YFV: high viral load - 104 copies/reaction, average viral load - 103 copies/reaction and low viral load - 102 copies/reaction. Each viral concentration was assayed in 8 replicates. The experiments were performed by 2 different operators and repeated in 4 separate assays; 2 experiments were conducted on the same day and the other 2 were carried out on different days (standard deviations are indicated). (B) Clinical samples from 17DD-YFV vaccinated individuals represented in 3 distinct concentrations: high viral load - 103 copies/reaction, average load - 102 copies/reaction and low viral load - 50 copies/reaction. Each viral concentration was assayed in 10 replicates. The assays were conducted by 2 different operators and repeated in 3 independent tests; 2 experiments were performed on the same day by different operators and one test was conducted on a different day by one operator (standard deviations are indicated).

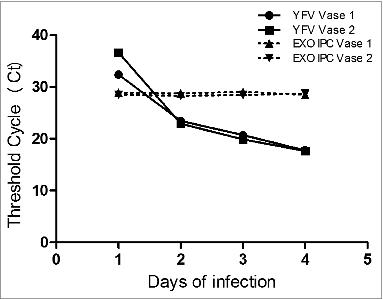
Figure 4. In vitro samples of 17DD-YFV propagated in serum-free medium from 2 bioreactor vases analyzed by RT-qPCR for the NS5 viral region and for the EXO IPC (exogenous control), in separate reactions on the same plate. The experiments were performed during the first 4 d of viral propagation. Dotted lines indicate the results for EXO IPC, showing minimal Ct variation between samples.

Table 3. Evaluation of the human RNase P gene as an endogenous internal amplification control in the TaqMan multiplex YFV RT-qPCR. Ct values for both RNAse P and NS5 region from yellow fever virus are indicated, as well as the standard deviation (SD). The samples were assayed in 8 replicates each

![Figure 5. Correlation between the YFV RT-qPCR method (copies/mL) and virus titration (PFU/mL), from 38 analyzed samples (clinical samples from YFV vaccinated individuals and in vitro propagated virus), indicated by the equation: Log10 PFU/mL = [0.974 × Log10 copies/mL] – 2.807.](/cms/asset/4e656c0f-2702-4f47-97ed-a95e777e094c/khvi_a_990854_f0005_b.gif)