
Figures & data
Figure 1. Serum IgG (green color) and IgM (blue color) antibody response to Spn proteins PhtD (A), LytB (B), PcpA (C), PhtE (D) and PlyD1 (E) in NOP children age 6–25 months. Serum IgG and IgM antibody concentrations were determined with a quantitative ELISA and then logarithm transformed. Mean (solid lines) and 95% confidence intervals (dashed lines) are shown and zero is shown as a red line. Functional estimates of log10 Concentration concentrations against age were obtained using a generalized additive model (left most panel). Antibody/age gradients (Δlog10 Concentration/ΔAge) with confidence bands are directly calculated from the fits, permitting the direct estimation and comparison of rates of (change in antibody rise)/(change in age) (right most panel). Response curves were estimated relative to a baseline defined at age 6 months, and therefore represent log transforms of proportional increase from that baseline. A total of 73 time points from 33 subjects were analyzed. Circles and crosses represent IgG data and IgM data, respectively.
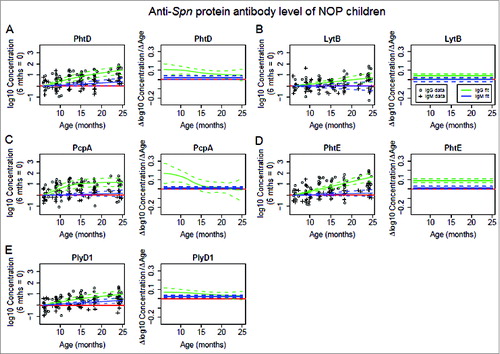
Figure 2. Serum IgG (green color) and IgM (blue color) antibody response to Spn proteins PhtD (A), LytB (B), PcpA (C), PhtE (D) and PlyD1 (E) in sOP children age 6–25 months. Serum IgG and IgM antibody concentrations were determined with a quantitative ELISA and then logarithm transformed. Mean (solid lines) and 95% confidence intervals (dashed lines) are shown and zero is shown as a red line. Functional estimates of log10 Concentration concentrations against age were obtained using a generalized additive model (left most panel). Antibody/age gradients (Δlog10 Concentration/ΔAge) with confidence bands are directly calculated from the fits, permitting the direct estimation and comparison of rates of (change in antibody rise)/(change in age) (right most panel). Response curves were estimated relative to a baseline defined at age 6 months, and therefore represent log transforms of proportional increase from that baseline. A total of 22 time points from 6 subjects were analyzed. Circles and crosses represent IgG data and IgM data, respectively.
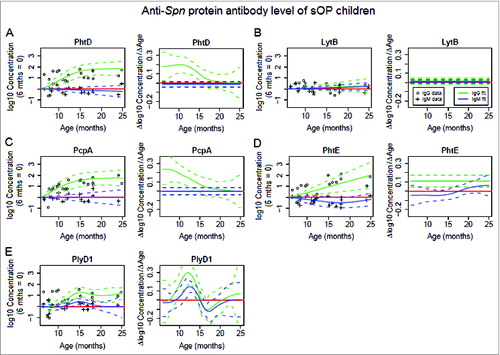
Figure 3. Range of age gradient for anti-Spn protein antibody concentrations. Barplots display the range (maximum - minimum) of the antibody/age gradients (Δlog10 Concentration/ΔAge) shown in (protiens PhtD, LytB, PcpA, PhtE, and PlyD1 for NOP and sOP subjects, respectively). Standard errors are included (not visible when approximately equal to zero).
Table 1. Demographics of the subjects