Figures & data
Figure 1. Inducible expression of the petE promoter in pSUN4KK2 by copper. GFP fluorescence from liquid cultures harboring the pSUN119 parent plasmid (A and B) and pSUN4KK2 (C and D) in the presence (A and C) and absence (B and D) of copper.
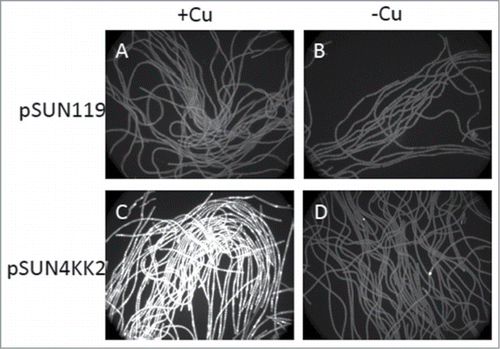
Figure 2. Result of reverse transcriptase (RT) PCR showing expression of MBO synthase gene in transgenic N. punctiforme strain SBG102. Lanes K1 and K2 are biological replication of control strain SBG101 bearing pSUN4KK2 and KM1 and KM2 are biological replication of transgenic strain SBG102 bearing pSUN4KK2-MBO. Lane L is size ladder, N is template negative control for PCR, NN is negative control using product from reaction lacking reverse transcriptase, P is positive control using the template pSUN4KK2-MBO.
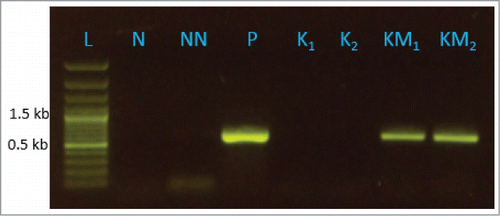
Figure 3. SDS-PAGE protein analysis of crude protein extracts from control and transgenic strains of N. punctiforme. Lanes, 1 is total soluble protein from control strain SBG101; 2 is total soluble protein from transgenic strain SBG102; L is standard protein ladder in kilodaltons (kD). A faint band similar in size to MBO synthase (comparable to 70 kD and present in lane 2 but absent in lane 1) indicates expression of MBO synthase at protein level.
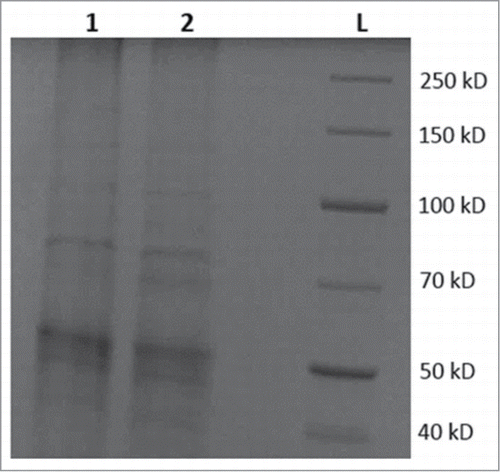
Figure 4. Chromatograph showing differential production of phytols in transgenic strains SBG102 (pink) verses control strains SBG101 (black) where peak 1, 2 and 3 represent phytol acetate and 2 phytols (likely sterioisomers), respectively. Numbers on the bottom represent retention time (RT) in minutes.
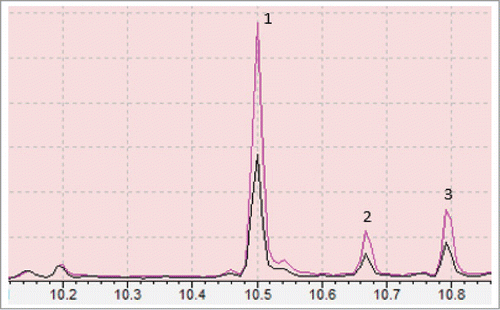
Figure 5. Quantification of phytols production in control SBG101 (white) verses transgenic SBG102 strains (gray). The y-axis indicates the amount of phytols in μg mg−1 Chlorophyll a and x-axis shows differentially expressed phytols identified in this study (n = 3). Error bars denote standard error.
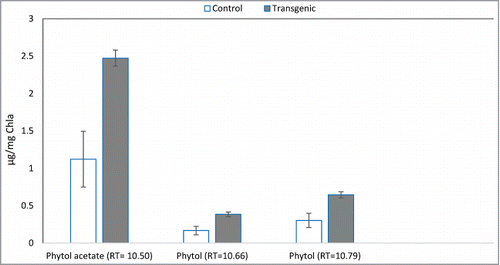
Figure 6. A plausible biosynthetic pathway leading to formation of phytol in N. punctiforme. In the above diagram enzymes I, 1, 2, 4, 5, 6 and 7 shown in green are potential native enzymes: IPP isomerase (enzyme I) geranyl diphosphate (GDP) synthase (enzyme 1); farnesyl diphosphate (FDP) synthase (enzyme 2); geranylgeranyl diphosphate (GGDP) synthase (enzyme 4); pyrophosphatases (enzyme 5); geranylgeranyl reductase (GGR) (enzyme 6) and geranylgeraniol (GGOH) reductase (enzyme 7). Enzyme 3 is the foreign MBO synthase. GDP synthase, FDP synthase and GGDP synthase shown in gray as 1*, 2* and 4* respectively, are bacterial class I prenyltransferases with proposed broad range substrates specificity. Solid black arrow represents already known or proposed pathways while gray arrows show plausible reactions proposed in this model. Structures are adopted from NCBI pubchem compound library (http://pubchem.ncbi.nlm.nih.gov).
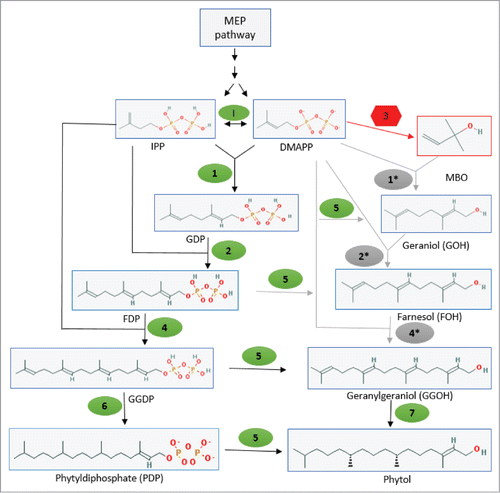
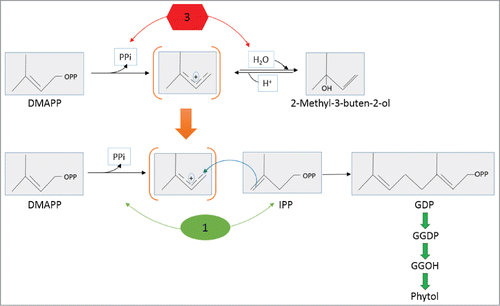
Figure 7. Alternative model leading to overproduction of phytol through supply of a metabolic intermediate created by MBO synthase to GDP synthase in N. punctiforme. MBO synthase (enzyme 3); GDP synthase (enzyme 1); transient carbocation common to both reactions is shown in brackets. Top and bottom panel is adapted fromCitation45 and,Citation46 respectively. OPP denotes pyrophosphate (PPi) attachment.