1,391
Views
14
CrossRef citations to date
0
Altmetric
Addendum

Muscle-specific microRNAs as biomarkers of Duchenne Muscular Dystrophy progression and response to therapies

, , , , &
Article: e974969 | Received 31 Jul 2014, Accepted 06 Oct 2014, Published online: 01 Dec 2014

Figures & data

Figure 1. Expression of BAF60a, BAF60c and miR-206 in FAPs isolated from young mdx mice treated with TSA (Trichostatin A). (A) Expression of BAF60c (Green), in growth medium (GM), was assessed by immunofluorescence. Nuclei were counterstained with DAPI (blue) (Left panel). The percentage of BAF60c positive cells per field was measured and reported as graphed (Right panel). The error bars indicate SEM. (B) Representative images of BAF60a (Red) expression assessed by immunofluorescence in GM (Left panel). Nuclei were counterstained with DAPI (blue). The right panel shows the percentage of BAF60a positive cells per field (Right panel). The error bars indicate SEM. (C) miR-206 expression in GM was evaluated by immunohistochemical staining of miR-206 (Blue/Purple). Nuclei were counterstained with DAPI (Blue for immunofluorescence or Yellow for phase contrast) (Left panel). (D) Myogenic differentiation potential was assessed by myosin heavy chain (MHC) immunofluorescence (Green) and adipogenic differentiation potential by Oil-Red O staining (Red). miR-206 expression in DM was evaluated by immunohistochemical staining. Nuclei were counterstained with DAPI (Blue for immunofluorescence or Yellow for phase contrast).
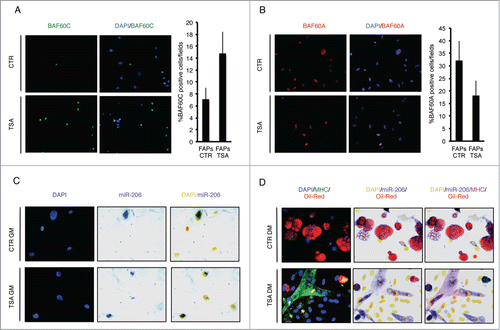
Figure 1. Expression of BAF60a, BAF60c and miR-206 in FAPs isolated from young mdx mice treated with TSA (Trichostatin A). (A) Expression of BAF60c (Green), in growth medium (GM), was assessed by immunofluorescence. Nuclei were counterstained with DAPI (blue) (Left panel). The percentage of BAF60c positive cells per field was measured and reported as graphed (Right panel). The error bars indicate SEM. (B) Representative images of BAF60a (Red) expression assessed by immunofluorescence in GM (Left panel). Nuclei were counterstained with DAPI (blue). The right panel shows the percentage of BAF60a positive cells per field (Right panel). The error bars indicate SEM. (C) miR-206 expression in GM was evaluated by immunohistochemical staining of miR-206 (Blue/Purple). Nuclei were counterstained with DAPI (Blue for immunofluorescence or Yellow for phase contrast) (Left panel). (D) Myogenic differentiation potential was assessed by myosin heavy chain (MHC) immunofluorescence (Green) and adipogenic differentiation potential by Oil-Red O staining (Red). miR-206 expression in DM was evaluated by immunohistochemical staining. Nuclei were counterstained with DAPI (Blue for immunofluorescence or Yellow for phase contrast).

Figure 2. myomiRs as biomarkers of HDACi activity in DMD. FAPs are key cellular determinants of DMD progression. In pathologic conditions these cells differentiate into adipocytes and fibroblasts leading to muscle degeneration. This process is driven by BAF60a and BAF60b-based SWI/SNF complex that promotes the expression of fibro-adipogenic genes. As a consequence of muscle wasting, myomiRs are released in the circulation and have been proposed as biomarkers of DMD disease (Left panel). HDACi treatment at early stages promotes compensatory regeneration by inducing in FAPs BAF60c, which directs myogenesis, and up-regulating myomiRs, which suppress the fibro- adipogenesis In this context, a local increase of myomiRs inversely correlates with the decrease of circulating myomiRs, suggesting that the ratio between circulating/local myomiRs could provide an accurate biomarker of disease progression and response to HDACi (Right panel).
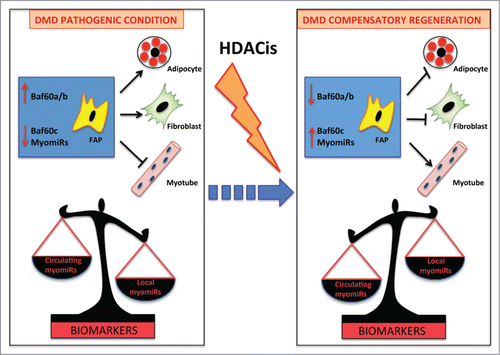
Figure 2. myomiRs as biomarkers of HDACi activity in DMD. FAPs are key cellular determinants of DMD progression. In pathologic conditions these cells differentiate into adipocytes and fibroblasts leading to muscle degeneration. This process is driven by BAF60a and BAF60b-based SWI/SNF complex that promotes the expression of fibro-adipogenic genes. As a consequence of muscle wasting, myomiRs are released in the circulation and have been proposed as biomarkers of DMD disease (Left panel). HDACi treatment at early stages promotes compensatory regeneration by inducing in FAPs BAF60c, which directs myogenesis, and up-regulating myomiRs, which suppress the fibro- adipogenesis In this context, a local increase of myomiRs inversely correlates with the decrease of circulating myomiRs, suggesting that the ratio between circulating/local myomiRs could provide an accurate biomarker of disease progression and response to HDACi (Right panel).