Figures & data
Figure 1. Immunohistochemistry analysis of E-cadherin, p120 catenin, Kaiso and MUC1 in patient samples with metastatic pancreatic cancer. (A) Representative immunohistochemical images of primary pancreatic tumor tissue from patients with metastatic pancreatic cancer, stained for E-cadherin, p120 catenin, Kaiso, and MUC1. Scale bar, 5 μm. (B) Heat map shows the relative expression levels of each antigen analyzed in samples from 23 rapid autopsies of individual patients as detected by immunohistochemistry, with relative expression levels indicated as described previously.Citation25 Patient samples are annotated for tumor grade, stage and survival post-diagnosis.
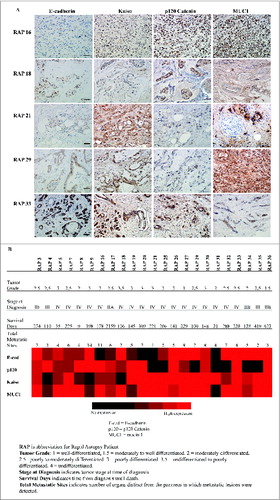
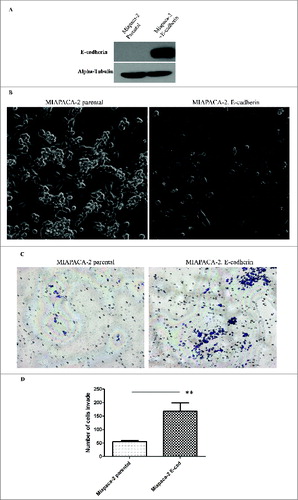
Figure 2. Ectopic expression of E-cadherin increases the Epithelial look of the cell but does not prevent in vitro invasion of tumor cells. (A) Western blot showing the expression level of E-cadherin in Miapaca-2 parental cells VS Miapaca-2 with E-cadherin overexpression. (B) Phase contrast photographs of control MIAPACA-2 cells and E-cadherin overexpressing MIAPACA-2 cells. (C) In vitro invasion assay of Miapaca-2 cells with/without E-cadherin. Experiment results are from 3 triplicates of 3 independent experiments. ** indicates the statistical analysis of the result shows significant difference. P < 0.01.