Figures & data
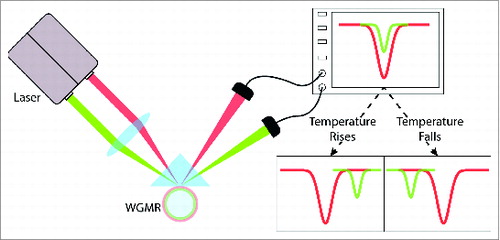
Figure 1. Schematic representation of the principle of the thermometer. 2 colors of light were coupled into the WGMR and they followed 2 modes of the resonator (as shown by the Lorentz shape dips on the screen). Temperature rise in the resonator causes the infrared light (red in the figure) to slow down with respect to the green light, while temperature fall causes it to speed up. This relative speed comparison is shown as the relative position change of the 2 dips (resonant features) on the screen.