Figures & data
Figure 1. Histopathologic characteristics and immune cell distribution in the skin of the thigh, dorsum and planta pedis of limb allografts and isografts on POD 5. (A) (thigh), (B) (dorsum), and (C) (planta pedis) depict a Banff grade II rejection in allograft skin on POD 5, however, the extent of the cell infiltrate and cell distribution varied between the sampling spots. In general, the diffuse dermal cell infiltrate was more prominent in the thigh (A), compared to the dorsum (B). An interface reaction and dermal involvement with migrated immune cells was found at both sampling spots, but with a focal restriction in the dorsum (B). In the planta pedis the cell infiltrate was very prominent in the perivascular areas, but epidermal involvement with epidermal immune cell migration was found as well, which is per definition a grade II rejection. In isograft skin only a mild dermal cell infiltrate (D) (thigh) or no signs of inflammation (E) (dorsum) and (F) (planta pedis) were found on POD 5.
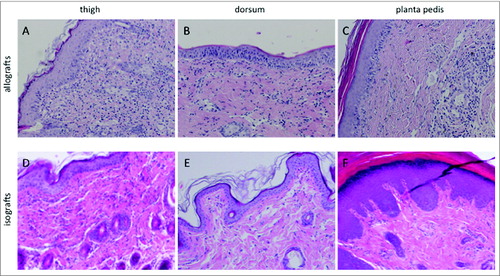
Figure 2. Characterization of allograft skin T cells at the 3 sampling areas on POD 5 using flow cytometry analysis. Skin T cells were isolated ex vivo and stained with antibodies against CD45, CD3, CD4 and CD8. Among the CD45+CD3+ T cell population around 60% were characterized as CD45+CD3+CD4+ T cells with no significant difference between the 3 sampling spots (thigh, planta pedis, dorsum) and the skin types (hair bearing vs hairless skin) (A). Around 30% of CD45+CD3+ T cells stained positive for CD8, again with no significant difference between the 3 sampling locations and the skin types (B).
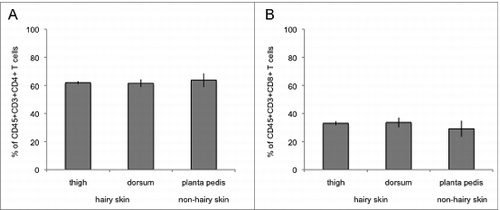
Table 1. Mean cytokine/chemokine levels and their significant changes in the three different skin areas of limb allografts on POD 5. Mean levels in pg/mg total protein from samples at the three different skin locations [thigh (TH), planta pedis (PP), dorsum (DO)] are presented. Adjusted p-values from Repeated Measure ANOVA and Bonferroni corrected p-values from pair-wise analyses are shown. Significant differences between the respective sites are indicated bold (p<0.05).
Figure 3. Comparison of the different cytokine levels in samples from different skin areas in limb allografts on POD 5 and control skin. Levels in pg/mg tissue protein are shown in log-scale at the different skin locations (thigh, planta pedis and dorsum). Lines indicate the paired design as samples at the different skin areas were taken from the same allograft. In general, tissue cytokine levels were found to be higher in the thigh and dorsum of allograft skin during moderate grade II rejection, compared to the planta pedis (A). This phenomenon was not true for baseline cytokine protein levels observed in naïve, non-transplanted control skin collected at the 3 defined sampling sites (B).
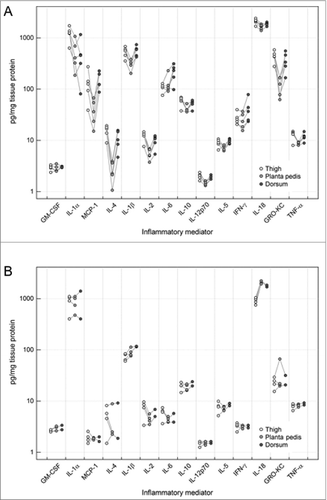
Figure 4. Heatmap visualizing log2-fold changes of cytokine levels between different locations [thigh (TH) versus planta pedis (PP) and dorsum (DO) vs. planta pedis] in each of the allografts on POD 5. Relative higher levels of inflammatory mediators (log2-fold changes>0 ) are indicated in red and lower levels (log2-fold changes<0 ) are indicated in blue according to the legend. Similar profiles of mediators across all allografts are grouped by average linkage hierarchical clustering as indicated by the dendogram (tree) at the left.
![Figure 4. Heatmap visualizing log2-fold changes of cytokine levels between different locations [thigh (TH) versus planta pedis (PP) and dorsum (DO) vs. planta pedis] in each of the allografts on POD 5. Relative higher levels of inflammatory mediators (log2-fold changes>0 ) are indicated in red and lower levels (log2-fold changes<0 ) are indicated in blue according to the legend. Similar profiles of mediators across all allografts are grouped by average linkage hierarchical clustering as indicated by the dendogram (tree) at the left.](/cms/asset/ea53677d-0888-4ef8-9464-c46225300c40/kvca_a_973795_f0004_c.jpg)
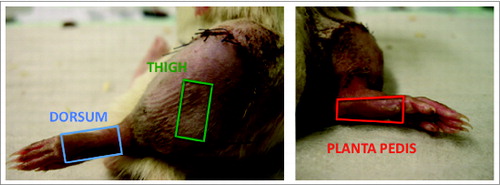
Figure 5. Areas of skin biopsy sampling at the 3 defined spots of a rat limb allograft. Three defined areas representing 2 skin types (hair bearing and hairless skin) were chosen to assess for skin rejection characteristics and severity in a rat vascularized composite allograft. Samples were taken from the lateral aspect of the thigh (green rectangle) with some distance to the coaptation site of the allograft and recipient skin, the dorsum excluding the toes (blue rectangle) and the planta pedis, again excluding the toes (red rectangle). The size of a skin sample was approximately 1.5 × 1.0 cm. The 3 different skin samples were collected from the same limb allograft on POD 5.