Figures & data
Figure 1. Time- and dose-dependent effects of TNFα on visfatin mRNA levels in 3T3-L1 adipocytes. Cells were harvested after treatment with TNFα at 15 ng/mL for 3, 6, 10, and 24 h or at 5, 10, 15, and 20 ng/mL for 24 h. Quantification of visfatin mRNA levels by real-time RT-PCR. Visfatin data were normalized to 18S rRNA.
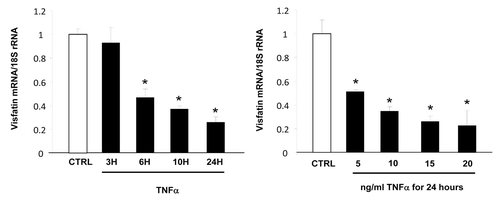
Figure 2. Transcriptional regulation of visfatin in 3T3-L1 adipocytes. (A) 3T3-L1 cells were incubated with or without TNFα (15 ng/mL) for 24 h. TNFα-mediated effects on C/EBPα were assessed at the mRNA level by quantitative RT-PCR and at the protein level by western blotting. mRNA quantification of C/EBPα was normalized to 18S rRNA. Protein quantification of C/EBPα is represented with regard to the quantity of β-actin. (B and C) 3T3-L1 adipocyte lysates were prepared from cells transfected with a control (non-targeted) siRNA or siRNA against C/EBPα. Quantification of C/EBPα (B) and visfatin (C) mRNA levels by quantitative RT-PCR. mRNA data were normalized to 18S rRNA. Data are presented as means ± SEM. *P < 0.05 (t test).
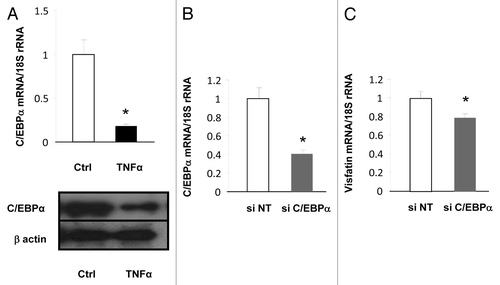
Figure 3. Downregulation of visfatin by TNFα leads to decreases in NAD+ concentrations and Sirt1 deacetylating activity in 3T3-L1 adipocytes. Cells were incubated with or without TNFα (15 ng/mL) for 24 h. (A and B) Intracellular concentrations of visfatin and NAD+. After incubation, cells were collected and processed for visfatin and NAD+ quantification as described in Materials and Methods. Values were determined in ng visfatin/mg of cellular protein and in ng NAD+/mg of cellular protein, respectively. Values are presented as means ± SEM. *P < 0.05 (t test). (C) Sirt1 activity in 3T3-L1 cells. Total cell lysates (20 μg) were submitted to a Sirt1 activity assay as described in Materials and Methods. Values are presented as means ± SEM. *P < 0.05 (t test). (D) Quantification of Sirt1 mRNA levels by quantitative RT-PCR. Sirt1 data were normalized to 18S rRNA. Data are presented as means ± SEM. *P < 0.05 (t test).
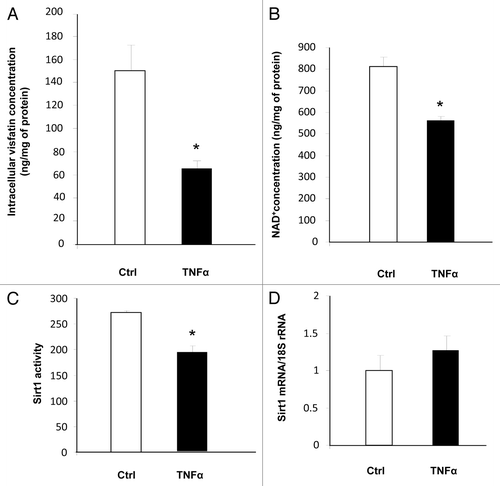
Figure 4. Regulation of PTP1B expression by TNFα and a Sirt1 activator in 3T3-L1 adipocytes. Cells were harvested after treatment with TNFα at 15 ng/mL for 3, 6, 10, and 24 h or at 5, 10, 15, and 20 ng/mL for 24 h. (A) Quantification of PTP1B mRNA levels by real-time RT-PCR. PTP1B data were normalized to 18S rRNA. Data are presented as means ± SEM. Data were compared among groups (Student t test), and those with no common superscript letter are significantly different; P < 0.05. (B) Cells were incubated with TNFα at 15 ng/mL for 3, 6, 10, and 24 h. Total cell lysates (40 μg) were subjected to SDS-PAGE and immunoblotted with PTP1B or β-actin antibodies. The western blot is representative of three independent experiments. (C) Cells were treated with or without SRT 1720 (10 μM) for 24 h. PTP1B mRNA was quantified using real-time RT-PCR, and data were normalized to 18S rRNA. Data are presented as means ± SEM. *P < 0.05 (t test).
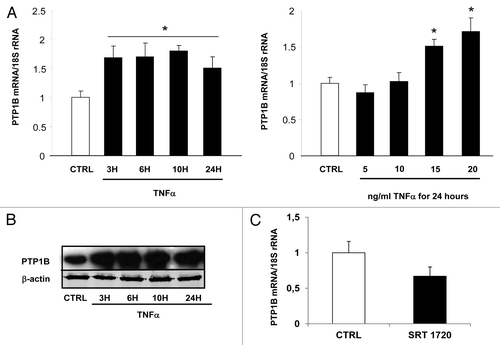
Figure 5. Inhibition of visfatin decreases NAD+ concentrations and induces PTP1B expression in 3T3-L1 adipocytes. (A–C) Cells were incubated with or without TNFα (15 ng/mL) and in the presence of the visfatin inhibitor FK866 at 1 and 10 nM for 24 h. (A) After incubation, cells were collected and processed for NAD+ quantification as described in Materials and Methods. Values were determined in ng NAD+/mg of cellular proteins. (B) PTP1B mRNA levels were quantified using real-time RT-PCR, and data were normalized to 18S rRNA. Data are presented as means ± SEM. Data were compared among groups (Student t test), and those with no common superscript letter are significantly different; P < 0.05. (C) Total cell lysates (40 μg) were subjected to SDS-PAGE and immunoblotted with PTP1B or β-actin antibodies. The western blot is representative of three independent experiments. (D–F) Cells transfected with control (non-targeted) siRNA or siRNA against visfatin were incubated with or without TNFα (15 ng/mL) for 24 h. (D) 3T3-L1 cells were collected and processed for NAD+ quantification as described in Materials and Methods. Values were determined in ng NAD+/mg of cellular proteins. (E) PTP1B mRNA levels were quantified using real-time RT-PCR, and data were normalized to 18S rRNA. Data are presented as means ± SEM. Data were compared among groups (Student t test), and those with no common superscript letter are significantly different; P < 0.05. (F) Total cell lysates (40 μg) were subjected to SDS-PAGE and immunoblotted with PTP1B or β-actin antibodies. The western blot is representative of three independent experiments.
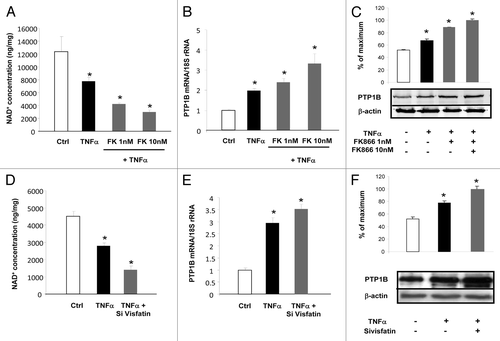
Figure 6. Glucose uptake is reduced by visfatin inhibition in 3T3-L1 adipocytes. (A) Adipocytes were incubated with or without TNFα (15 ng/mL) and in the presence of FK866 at 1 nM for 24 h. Cells were serum-starved for 1 h before a 30 min stimulation with insulin (0 and 170 nM). 2-deoxy-D-[3H]glucose uptake was measured as described in Materials and Methods. The uptake measurements were performed in triplicates and normalized to protein concentrations. Results (means ± SEM) are expressed as percentage of maximum uptake. (B) Akt phosphorylation is reduced by visfatin inhibition in differentiated 3T3-L1 cells. Adipocytes were incubated with or without TNFα (15 ng/mL) and in the presence of FK866 at 1 nM for 24 h. Total cell lysates (40 μg) were subjected to SDS-PAGE and immunoblotted with phospho-AKT or AKT antibodies. The western blot is representative of three independent experiments.
![Figure 6. Glucose uptake is reduced by visfatin inhibition in 3T3-L1 adipocytes. (A) Adipocytes were incubated with or without TNFα (15 ng/mL) and in the presence of FK866 at 1 nM for 24 h. Cells were serum-starved for 1 h before a 30 min stimulation with insulin (0 and 170 nM). 2-deoxy-D-[3H]glucose uptake was measured as described in Materials and Methods. The uptake measurements were performed in triplicates and normalized to protein concentrations. Results (means ± SEM) are expressed as percentage of maximum uptake. (B) Akt phosphorylation is reduced by visfatin inhibition in differentiated 3T3-L1 cells. Adipocytes were incubated with or without TNFα (15 ng/mL) and in the presence of FK866 at 1 nM for 24 h. Total cell lysates (40 μg) were subjected to SDS-PAGE and immunoblotted with phospho-AKT or AKT antibodies. The western blot is representative of three independent experiments.](/cms/asset/13ad3786-28c7-4a38-bd4c-7f28ee4ec5f0/kadi_a_10928729_f0006.gif)
