1,300
Views
4
CrossRef citations to date
0
Altmetric
Research Papers

Gene expression profiling in adipose tissue from growing broiler chickens

, , , &
Pages 297-303 | Received 20 Nov 2013, Accepted 15 May 2014, Published online: 30 Oct 2014

Figures & data

Figure 1. Body weights by gender and age of broilers. Each age group represents 4 females and 5 males except 5 wk, which has 4 females and 4 males (data = mean ± SEM). Age similarly increased body weights of male and female broiler chickens (P value < 0.05).
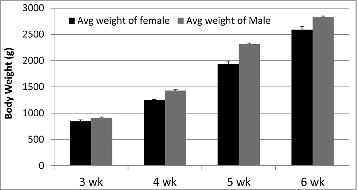
Figure 1. Body weights by gender and age of broilers. Each age group represents 4 females and 5 males except 5 wk, which has 4 females and 4 males (data = mean ± SEM). Age similarly increased body weights of male and female broiler chickens (P value < 0.05).

Figure 2. Summary of differentially expressed (DE) transcripts (q < 0.07) in chicken adipose tissue. Number of differentially expressed transcripts for female and male are across all ages. P value cutoffs for 3 to 6 wk, 4 to 6 wk, 3 to 4 wk, female, and male are 6.1E–4, 4.8E–4, 8.0E–5, 1.9E–3, and 1.9E–3 respectively.
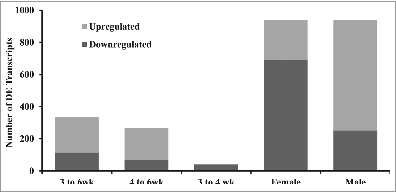
Figure 2. Summary of differentially expressed (DE) transcripts (q < 0.07) in chicken adipose tissue. Number of differentially expressed transcripts for female and male are across all ages. P value cutoffs for 3 to 6 wk, 4 to 6 wk, 3 to 4 wk, female, and male are 6.1E–4, 4.8E–4, 8.0E–5, 1.9E–3, and 1.9E–3 respectively.

Table 1. Main themes and enrichment scoresa from DAVIDb of clusters of GO Biological Process categories for up and downregulated genes (q < 0.07) in adipose tissue

Table 2. Summary of changes in adipose tissue with age displaying pathway themes,a pathways,b and number of genesc associated

Table 3. Immune related and other genes in chicken adipose tissue that were influenced by age. Log2 fold changes are a comparison of quantitative real-time PCR expression values from different ages

Figure 3. Quantitative real-time PCR (qPCR) validation of microarray data on a subset of genes in adipose tissue. Gene expression, log2-fold changes, measured by microarray compared with qPCR. Genes were selected based on relevant age related changes in the microarray analysis. Representative Affymetrix probe sets were chosen by the best alignment of the Affymetrix probe set target sequence to the Taqman Gene Expression Assay context sequence. All genes had a difference (P < 0.05, factorial ANOVA) in qPCR expression between age groups. Microarray changes were statistically significant.
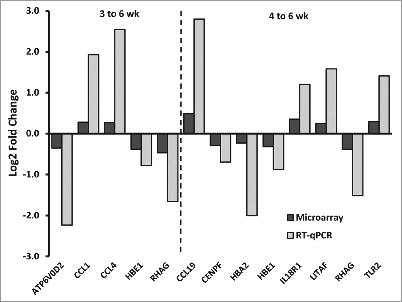
Figure 3. Quantitative real-time PCR (qPCR) validation of microarray data on a subset of genes in adipose tissue. Gene expression, log2-fold changes, measured by microarray compared with qPCR. Genes were selected based on relevant age related changes in the microarray analysis. Representative Affymetrix probe sets were chosen by the best alignment of the Affymetrix probe set target sequence to the Taqman Gene Expression Assay context sequence. All genes had a difference (P < 0.05, factorial ANOVA) in qPCR expression between age groups. Microarray changes were statistically significant.

Table 4. Taqman primers

Supplemental material

964518_Supplemental_files.zip

Download Zip (248 KB)

Reprints and Corporate Permissions

Please note: Selecting permissions does not provide access to the full text of the article, please see our help page How do I view content?

To request a reprint or corporate permissions for this article, please click on the relevant link below:

Academic Permissions

Please note: Selecting permissions does not provide access to the full text of the article, please see our help page How do I view content?

Obtain permissions instantly via Rightslink by clicking on the button below:

If you are unable to obtain permissions via Rightslink, please complete and submit this Permissions form. For more information, please visit our Permissions help page.