Figures & data
Table 1. Fatty acid profile (g/100 g adipose tissue) of subcutaneous adipose tissue for donor steers that grazed legume pastures with (LC) or without (L) corn grain supplementation (0.75% of body weight/d)
Table 2. Fatty acid profile (μg/well) of intermuscular adipocyte cultures at 6 d from steers that grazed legume pastures with (LC) or without (L) corn gain supplementation (0.75% of body weight/d). Cultures from each treatment group (L or LC) received 0 or 100 μM addition of linoleic (C18:2)
Figure 1. Cell proliferation of intermuscular preadipocytes at 24, 48, and 74 h in culture from steers that grazed legume pastures with (LC) or without (L) corn grain supplementation (0.75% of body weight/d). *Within a time point, LC group differs from L group (P < 0.05). **Time means differ from 24 h (P < 0.05).
Figure 2. Cell sizing [(A) diameter, μM; (B) volume, pL] of intermuscular adipocyte cultures from steers that grazed legume pastures with (LC) or without (L) corn grain supplementation (0.75% of body weight/d) at various days in culture. *Within a time point, LC group differs from L group (P < 0.05). Each time point with a different alphabet differs significantly (P < 0.05).
![Figure 2. Cell sizing [(A) diameter, μM; (B) volume, pL] of intermuscular adipocyte cultures from steers that grazed legume pastures with (LC) or without (L) corn grain supplementation (0.75% of body weight/d) at various days in culture. *Within a time point, LC group differs from L group (P < 0.05). Each time point with a different alphabet differs significantly (P < 0.05).](/cms/asset/bd939608-4e8e-4962-ac40-9ff6cb174c7c/kadi_a_964532_f0002_b.gif)
Figure 3. Cell size distribution of intermuscular adipocyte cultures at different days in culture from steers that grazed legumes with (LC) or without (L) corn grain supplementation (0.75% of body weight/d). Differentiation cocktail was added on d0. (A) L group, (B) LC group, and (C) Distribution.
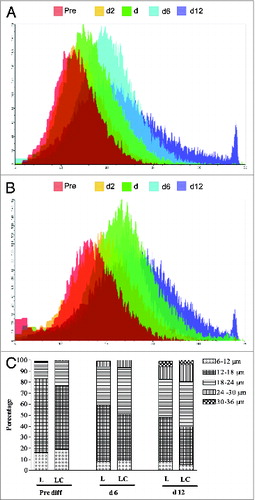
Figure 4. Relative mRNA expression of bovine intermuscular adipocytes at various days (d −2, 2, 4, 6, and 12) in culture. Bovine preadipocytes were isolated from steers that grazed legume pastures with (LC) or without (L) corn grain supplementation (0.75% of body weight/d) and differentiation cocktail added on d0 to stimulate differentiation. *Within a time point, LC group differs from L group (P < 0.05).
Figure 5. Lipogenesis in bovine intermuscular adipocyte cultures from steers that grazed legume pastures with (LC) or without (L) corn grain supplementation (0.75% of body weight/d). (A) Estimation of molar percent excess (MPE) of acetate after [1-13C]2 addition to the media. (B) Tracer-to-tracee (TTR) ratio of C16:0. (C) Tracer-to-tracee (TTR) ratio of C16:0. (D) Tracer-to-tracee (TTR) ratio of C18:0. (E) Tracer-to-tracee (TTR) ratio of C18:0. (F) Fractional synthetic rate of 13C-16:0 synthesized from 1,2-13C-acetate over a period of 48 h. (G) Fractional synthetic rate of 13C-18:0 synthesized from 1,2-13C-acetate over a period of 48 h.
![Figure 5. Lipogenesis in bovine intermuscular adipocyte cultures from steers that grazed legume pastures with (LC) or without (L) corn grain supplementation (0.75% of body weight/d). (A) Estimation of molar percent excess (MPE) of acetate after [1-13C]2 addition to the media. (B) Tracer-to-tracee (TTR) ratio of C16:0. (C) Tracer-to-tracee (TTR) ratio of C16:0. (D) Tracer-to-tracee (TTR) ratio of C18:0. (E) Tracer-to-tracee (TTR) ratio of C18:0. (F) Fractional synthetic rate of 13C-16:0 synthesized from 1,2-13C-acetate over a period of 48 h. (G) Fractional synthetic rate of 13C-18:0 synthesized from 1,2-13C-acetate over a period of 48 h.](/cms/asset/9823c9fb-af32-4380-8648-cdc546093b50/kadi_a_964532_f0005_b.gif)
Figure 6. Glycerol 3-phosphate dehydrogenase activity of intermuscular adipocyte cultures at 6 and 12 d of culture from steers that grazed legume pastures with (LC) or without (L) corn grain supplementation (0.75% of body weight/d). *Within a time point, LC group differs from L group (P < 0.05). **Time means differ from 24 h (P < 0.05).
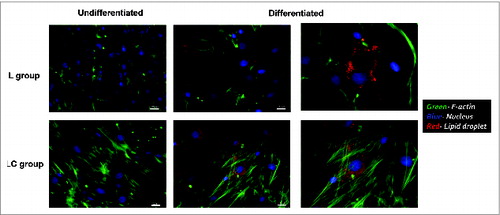
Figure 7. Photomicrographs of the intermuscular preadipocytes and adipocytes after differentiation from steers that grazed legume pasture with (LC) or without (L) corn grain supplementation (0.75% of body weight/d).