Figures & data
Table 1. Clinical and laboratory characteristics of the subjects (n = 11) before and after rosiglitzone treatment for 90 d
Figure 1. Adipose cell size distribution by curve fitting. (A) Raw adipose cell size distributions of a representative subject (no. 5) from pre-treatment and subsequent five visits with rosiglitazone. Abdominal subcutaneous fat biopsies (20–30 mg) from the patient before and after each treatment with rosiglitazone were obtained with a needle aspiration technique from the paraumbilical region, fixed with osmium tetroxide, and analyzed with Coulter Counter Multisizer III as described in Materials and Methods. Data were plotted with cell diameter (μm) using linear bins against relative frequency in percentage. The data also show labile character of fraction of large adipose cells and peak center, which first increase then decrease. (B) An example of the adipose cell size distribution from one individual fitted to a formula that generates seven parameters as described in the Materials and Methods. Dotted line represents the raw data points and the solid line the fitted curve. The fitted curve consists of two exponentials, capturing the tail of small adipose cells, plus a Gaussian function, capturing the peak of large adipose cells. Nadir, the lowest point between the fraction of the small adipose cells (the area under the two exponentials) and that of the large adipose cells (the area under the Gaussian peak); peak or cp, the peak diameter of the large adipose cells. (C) Fitted curves of adipose cells size distributions generated from the average parameters of 11 subjects before (visit 1, solid line) and after rosiglitazone treatment (visit 6, dashed line).
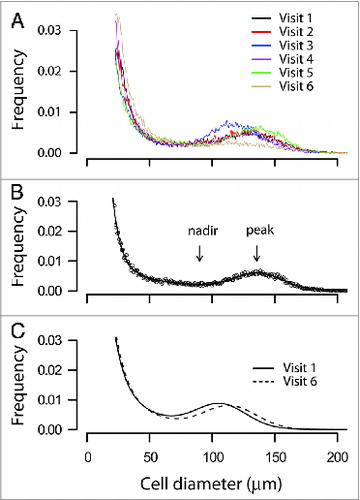
Figure 2. Time courses of the centers of the large adipose cell peak from all subjects (n = 11) treated with rosiglitazone for 90 d. The center (cp) of the large adipose cell was defined in and Materials and Methods. The values of cp were obtained from the fitted curves of adipose cell size distributions of each patient before and following each treatment at indicated time points. Time courses were fit to a linear (dashed line). Data were analyzed with a linear mixed effects model using the function 1mer in R as described in the Materials and Methods.
Figure 3. Time courses of the fraction of adipose cells below nadir from all subjects (n = 11) treated with rosiglitazone for 90 d. The fraction below nadir (FBN) represents the fraction of small adipose cells as defined in and Methods. The values of FBN were obtained from the fitted curves of adipose cell size distributions of each patient before and following each treatment at indicated time points. Data were analyzed as in . Note that the disconnection in the data points in subject No. 9 was due to an accidental loss of the data point of the third visit.