Figures & data
Figure 1. Preconditioning-induced autophagy activation contributes to neuroprotection in primary cultured cortical neurons. In IPC groups, cortical neurons were subjected to OGD for 30 min and then reperfused for 1–6 h. In OGD groups, neurons were deprived of oxygen and glucose for 1–6 h. In IPC+OGD groups, neurons were preconditioned for 30 min and exposed to OGD 24 h later for 1?6 h. The protein levels of LC3 and p62 were detected with immunoblotting. Levels of β-actin protein were used as the loading control. Quantitative analysis was performed with Sigma Scan Pro 5. (A) Protein expression of LC3. (B) Protein expression of p62. (C and D) 3-MA abolished IPC mediated neuroprotection in primary cultured cortical neurons. Cortical neurons were pre-incubated with 3-MA (5–20 mM) or BAF (37.5–150 nM) 30 min before the onset of IPC. After 24 h of reperfusion, a lethal OGD was induced by deprivation of oxygen and glucose for 6 h. The cell injury was evaluated by morphological changes and LDH leakage and MTT assay. (C) Cell morphological changes were observed with phase contrast microscopy. Bar = 50 μm. (D) 3-MA increased the LDH leakage of the cortical neurons. 3-MA (S) = 3-MA 5 mM; 3-MA (M) = 3-MA 10 mM; 3-MA (L) = 3-MA 20 mM. (E) Bafilomycin A1 (BAF) abolished the IPC elicited neuroprotection in cortical neurons. BAF (S) = BAF 37.5 nM; BAF (M) = BAF 75 nM; BAF (L) = BAF 150 nM. Bar represents mean ± SD, n = 6. *p < 0.05, **p < 0.01 vs. control group; #p < 0.05, ##p < 0.01 compared with the OGD group at each time point; $$p < 0.01 vs. IPC+OGD group.
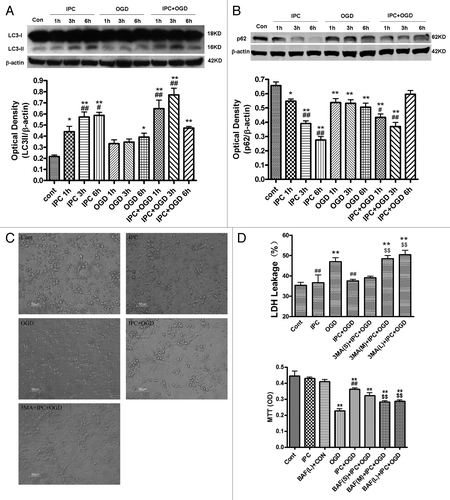
Figure 2. 3-MA inhibited IPC-induced autophagy activation in cortical neurons. Cortical neurons were pre-incubated with 3-MA (10 mM) 30 min before the onset of IPC (OGD for 30 min). After 24 h of reperfusion, a lethal OGD was induced by deprivation of oxygen and glucose for 3 h. The protein levels of LC3 and p62 were detected with immunoblotting. Levels of β-actin protein were used as the loading control. Quantitative analysis was performed with Sigma Scan Pro 5. (A) Protein expression of LC3. (B) Protein expression of p62. Bar represents mean ± SD, n = 6. *p < 0.05, **p < 0.01 compared with the control group; #p < 0.05, ##p < 0.01 compared with the OGD group; $$p < 0.05, $$p < 0.01 compared with IPC+OGD group. (C) Cortical neurons were fixed with 4% paraformaldehyde and processed for immunofluorescence. Representative images of cortical neurons were stained with DAPI (blue), and antibodies against LC3 (red) and MAP-2 (green). Note, LC3 immunostaining was upregulated in IPC and IPC+OGD groups. Bar = 10 μm. (D): The formation of autophagic vacuoles is suggested by punctate MDC staining. Cells were labeled with MDC and observed with a fluorescent microscope. Bar = 10 μm. Microphotographs were shown as representative results from three independent experiments.
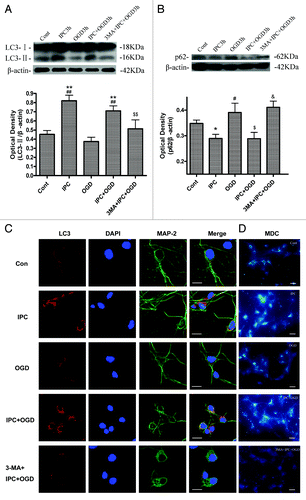
Figure 3. 3-MA decreased HSP70 and GRP78 expression, while increasing CHOP, cleaved caspase-12 and caspase-3 expression in cortical neurons. Cortical neurons were treated as described in the legend to . The protein levels of HSP70, GRP78, CHOP, caspase-12 and caspase-3 were detected with immunoblotting. Levels of β-actin protein were used as the loading control. Quantitative analysis was performed with Sigma Scan Pro 5. (A): Protein expression of HSP70. (B) Protein expression of GRP78. (C) Protein expression of CHOP. (D) Protein expression of caspase-12. (E) Protein expression of caspase-3. Bar represents mean ± SD, n = 6. *p < 0.05, **p < 0.01 compared with the control group; #p < 0.05, ##p < 0.01 compared with the OGD group; $p < 0.05, $$p < 0.01 compared with IPC+OGD group.
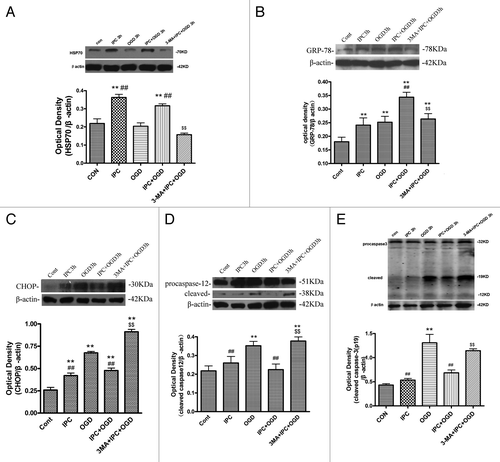
Figure 4. 3-MA decreased HSP60 and GRP78 expression, while increasing CHOP, caspase-12 and caspase-3 expression in a rat model of ischemic preconditioning. Rats were treated with a single i.c.v. of 3-MA 200 nmol 5 min before the onset of IPC (10 min MCA occlusion). A lethal ischemia was induced by PFI. Rats were killed 24 h after ischemia. Extracts from the ischemic and sham-operated cortex were separated on SDS-PAGEL and protein levels were detected with immunoblotting. Levels of β-actin protein were used as the loading control. Quantitative analysis was performed with Sigma Scan Pro 5. (A) Protein expression of HSP60. (B) Protein expression of GRP78. (C) Protein expression of CHOP. (D) Protein expression of caspase-12. (E) Protein expression of caspase-3. (F) Protein expression of P-eIF2α and eIF2α. Bar represents mean ± SD, n = 6. *p < 0.05, **p < 0.01 compared with the sham-operated group; #p < 0.05, ##p < 0.01 compared with the PFI group; $p < 0.05, $$p < 0.01 compared with the vehicle+IPC+PFI group.
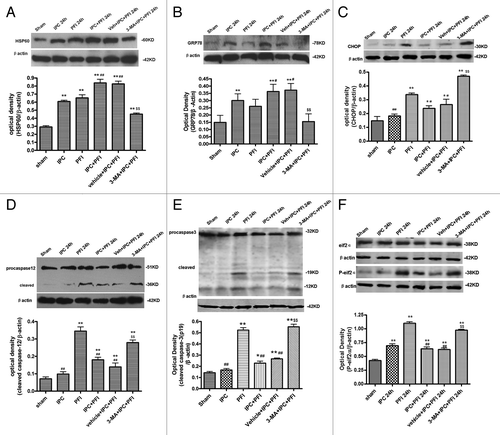
Figure 5. ER ultrastructural changes in the neurons of ischemic cortex after ischemic preconditioning. Rats were treated with a single i.c.v. injection of 3-MA 200 nmol 5 min before the onset of IPC. Lethal ischemia was induced by PFI. Rats were killed 6 h or 24 h after ischemia. Rats were perfused with 4% paraformaldehyde and 0.25% glutaraldehyde and were processed for electron microscopic examination. Photomicrographs represent samples taken from 3 rats in each group. Scale bars: 1 μm. N: nucleus; ER: rough endoplasmic reticulum; AV: autophagosomes; arrows indicate protein aggregates within ER lumen or associated with ER.
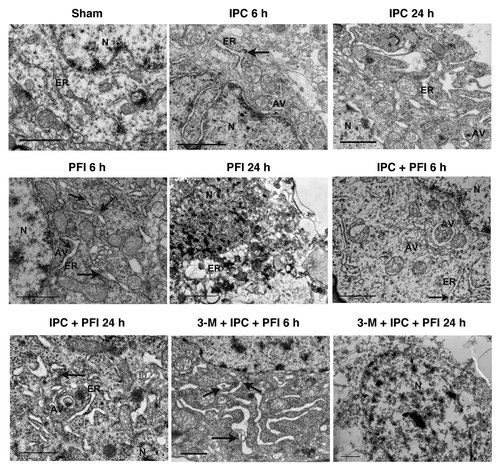
Figure 6. Salubrinal (Sal) inhibited 3-MA-induced neuronal damage. Rats were treated with a single i.c.v injection of Sal (75 pmol); 10 min later, 3-MA (200 nmol) was administered 5 min before the onset of IPC (10 min MCA occlusion). Lethal ischemia was induced by PFI. Rats were killed 24 h after ischemia. (A) TTC staining of brain sections. Infarct brain regions display white after TTC staining. (B) Quantitative analysis of brain infarct volume. (C) Sal pretreatment decreased brain edema. (D and E) Extracts from the ischemic and sham-operated cortex were separated on SDS-PAGEL and protein levels were detected with immunoblotting. Levels of β-actin protein were used as the loading control. Quantitative analysis was performed with Sigma Scan Pro 5. (D) Protein expression of P-eIF2α and eIF2α. (E) Protein expression of caspase-12. Bar represents mean ± SD, n = 6. *p < 0.05, **p < 0.01 compared with the sham-operated group; #p < 0.05, ##p < 0.01 compared with PFI group. $p < 0.05, $$p < 0.01 compared with the IPC+PFI group; &p < 0.05, &&p < 0.01 compared with the 3-MA+IPC+PFI group.
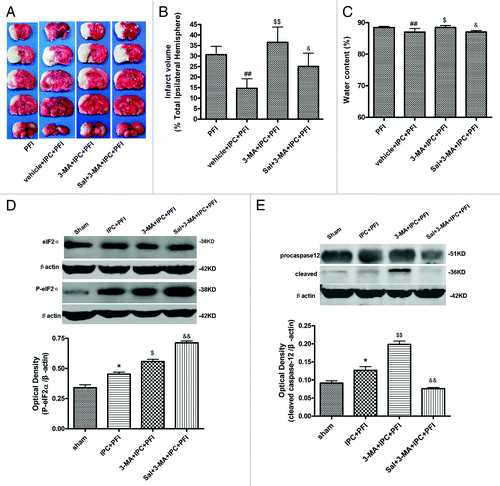
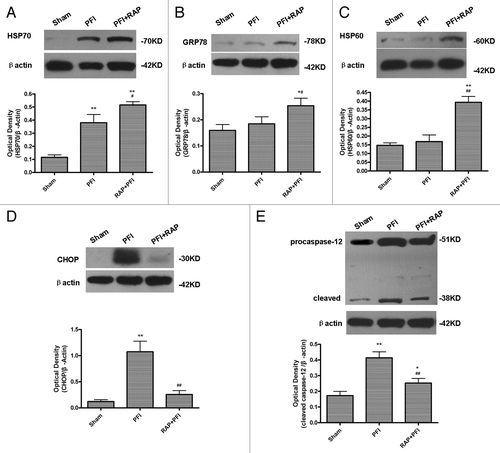
Figure 7. Rapamycin increased HSP70, HSP60, GRP78 expression, while decreasing CHOP and cleaved caspase-12 expression in ischemic cortex. Rats were treated with a single i.c.v. injection of rapamycin 35 pmol 24 h before the onset of PFI. PFI animals received an i.c.v. injection of same volume of vehicle. Rats were killed 24 h after ischemia. The extracts from the ischemic and sham-operated cortex were prepared and separated on SDS-PAGEL and protein levels were detected with immunoblotting. (A) Protein expression of HSP70. (B) Protein expression of GRP78. (C) Protein expression of HSP60. (D) Protein expression of CHOP. (E) Protein expression of caspase-12. Levels of β-actin protein were used as the loading control. Quantitative analysis was performed with Sigma Scan Pro 5. Bar represents mean ± SD, n = 6. *p < 0.05, **p < 0.01 compared with the sham–operated group; #p < 0.05, ##p < 0.01 compared with PFI group.