3,436
Views
87
CrossRef citations to date
0
Altmetric
Basic Research Paper

Autophagy provides nutrients for nonassimilating fungal structures and is necessary for plant colonization but not for infection in the necrotrophic plant pathogen Fusarium graminearum

, , , , , , & show all
Pages 326-337 | Received 01 Dec 2010, Accepted 08 Nov 2011, Published online: 13 Jan 2012

Figures & data

Figure 1. (A) Disruption strategy for F. graminearum atg8 gene. Homologous recombination between the disruption cassette and the Fgatg8 gene inserted the hygromycin resistance gene (HYG) at the indicated sites. (B) DNA gel blot analysis of XhoI- digested genomic DNA using part of the atg8 gene and the hygromycin cassette as probe.

Figure 1. (A) Disruption strategy for F. graminearum atg8 gene. Homologous recombination between the disruption cassette and the Fgatg8 gene inserted the hygromycin resistance gene (HYG) at the indicated sites. (B) DNA gel blot analysis of XhoI- digested genomic DNA using part of the atg8 gene and the hygromycin cassette as probe.

Figure 2. (A) Validation results of F. graminearum atg8 gene insertion in the ΔFgatg8 strain. Chromosome 4, 3157631–3159167 bp with sequence of geneticin resistance NPTII cassette and F. graminearum atg8 gene inserted by homologous recombination. (B) PCR analysis with primer pairs (1) upsActHFwd/nptIIRev, (2) nptIIFwd/Atg8upsFW and (3) Atg8dwnRev/dwnActHrRev. (C) DNA gel blot analysis with (4) SspI and HindII digested genomic DNA and primer pairs (5) nptIIFwd/nptIIRev was used as probe.
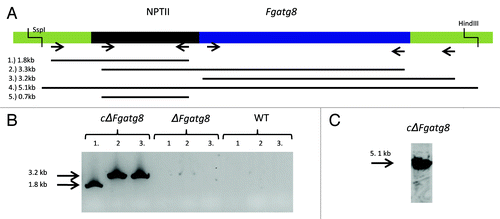
Figure 2. (A) Validation results of F. graminearum atg8 gene insertion in the ΔFgatg8 strain. Chromosome 4, 3157631–3159167 bp with sequence of geneticin resistance NPTII cassette and F. graminearum atg8 gene inserted by homologous recombination. (B) PCR analysis with primer pairs (1) upsActHFwd/nptIIRev, (2) nptIIFwd/Atg8upsFW and (3) Atg8dwnRev/dwnActHrRev. (C) DNA gel blot analysis with (4) SspI and HindII digested genomic DNA and primer pairs (5) nptIIFwd/nptIIRev was used as probe.

Figure 3. Formation of autophagic compartments in hyphae after induction by starvation or rapamycin treatment. F. graminearum WT (left panel) and ΔFgatg8 (right panel) mycelium were grown in YPD, YPD + rapamycin or in H2O and stained with monodansyl cadavarine (MDC). DIC and fluorescence images of the MDC staining are shown. Fluorescence images are taken using the same microscope and camera settings. Bars = 5 µm.

Figure 3. Formation of autophagic compartments in hyphae after induction by starvation or rapamycin treatment. F. graminearum WT (left panel) and ΔFgatg8 (right panel) mycelium were grown in YPD, YPD + rapamycin or in H2O and stained with monodansyl cadavarine (MDC). DIC and fluorescence images of the MDC staining are shown. Fluorescence images are taken using the same microscope and camera settings. Bars = 5 µm.

Figure 4. Aerial mycelium growth. Petri dishes with ΔFgatg8, WT and cΔFgatg8 strains cultivated on DFM media for 6 d at 22°C. Petri dishes = 9 cm diameter.
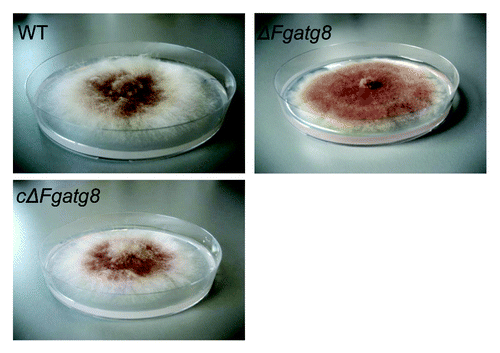
Figure 4. Aerial mycelium growth. Petri dishes with ΔFgatg8, WT and cΔFgatg8 strains cultivated on DFM media for 6 d at 22°C. Petri dishes = 9 cm diameter.

Table 1. Linear growth rate in mm/d at 19°C measured in growth pipettes with different media

Figure 5. Scanned images of aerial mycelium on 18 x 18 mm cover glasses with an arrow to the left indicating the level of the agar surface (left image). The DIC microscope images (middle image) and corresponding fluorescence microscopy images (right image). Microscope images show a contorted thin mycelium containing lipid droplets for the ΔFgatg8-mutant while this is absent in WT and cΔFgatg8 strains. HCS LipidTOX Red staining and fluorescence microscopy confirms the presence of lipid droplets in the ΔFgatg8-mutant and their absence in the other strains. Bars = 20 µm.
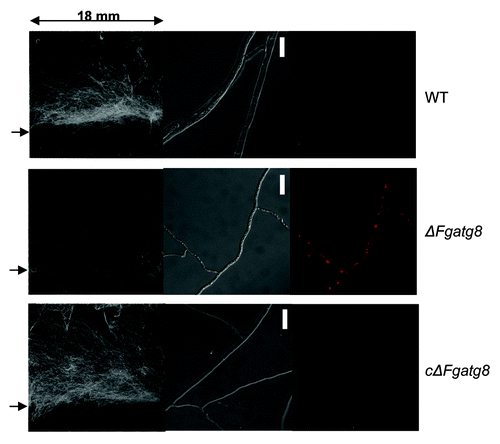
Figure 5. Scanned images of aerial mycelium on 18 x 18 mm cover glasses with an arrow to the left indicating the level of the agar surface (left image). The DIC microscope images (middle image) and corresponding fluorescence microscopy images (right image). Microscope images show a contorted thin mycelium containing lipid droplets for the ΔFgatg8-mutant while this is absent in WT and cΔFgatg8 strains. HCS LipidTOX Red staining and fluorescence microscopy confirms the presence of lipid droplets in the ΔFgatg8-mutant and their absence in the other strains. Bars = 20 µm.

Figure 6. Lipid droplets in mycelia of F. graminearum strains after 48 h incubation in 1/10 DFM with 2x glucose and NO3 as nitrogen source and a subsequent change in nutrient solution and a further 48 h incubation in four times NO3 with no glucose. Inserts shows parts of images of similar cultures after the first 48 h and before the shift to high N and no C medium to show that all treatments starts with the same amounts of lipid droplets after the initial incubation. The lipid droplets was stained with the fluorescent stain Nile Red and filters and image processing optimized for showing lipid droplets. Bars = 50 µm.
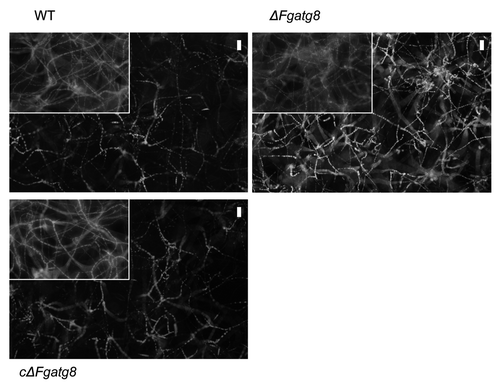
Figure 6. Lipid droplets in mycelia of F. graminearum strains after 48 h incubation in 1/10 DFM with 2x glucose and NO3 as nitrogen source and a subsequent change in nutrient solution and a further 48 h incubation in four times NO3 with no glucose. Inserts shows parts of images of similar cultures after the first 48 h and before the shift to high N and no C medium to show that all treatments starts with the same amounts of lipid droplets after the initial incubation. The lipid droplets was stained with the fluorescent stain Nile Red and filters and image processing optimized for showing lipid droplets. Bars = 50 µm.

Figure 7. Mycelia growth over a plastic Petri dish surface after 3 d incubation at room temperature (22°C).
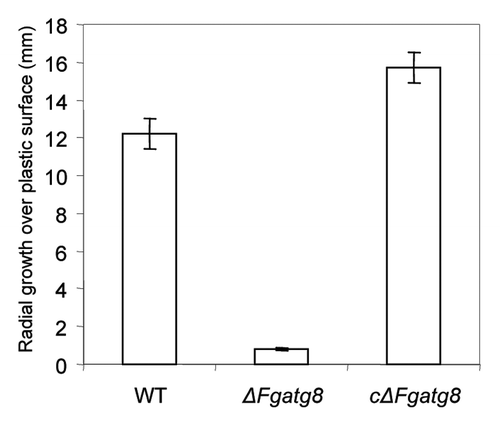
Figure 7. Mycelia growth over a plastic Petri dish surface after 3 d incubation at room temperature (22°C).

Figure 8. Conidia production of the different strains per DFM plate incubated 19 d at room temperature (22°C).
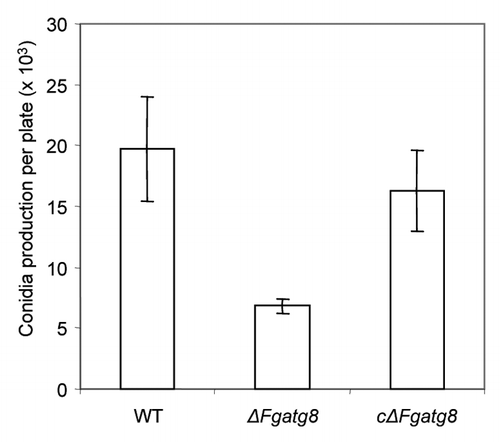
Figure 8. Conidia production of the different strains per DFM plate incubated 19 d at room temperature (22°C).

Figure 9. Infection of barley spikes with F. graminearum, (A) WT and (B) ΔFgatg8 mutant 10 d after spray inoculation.
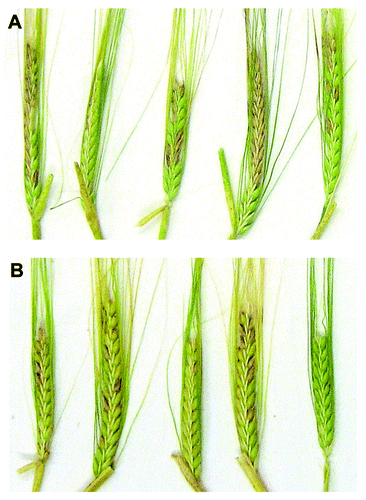
Figure 9. Infection of barley spikes with F. graminearum, (A) WT and (B) ΔFgatg8 mutant 10 d after spray inoculation.

Figure 10. Comparison of F. graminearum, WT and ΔFgatg8 mutant infection of barley spikes over time.
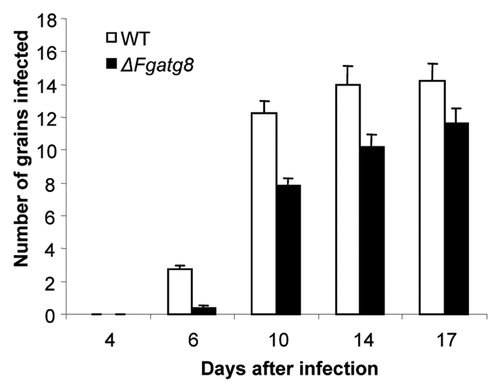
Figure 10. Comparison of F. graminearum, WT and ΔFgatg8 mutant infection of barley spikes over time.

Figure 11. Wheat spikes 21 d after point inoculation. Arrows indicate infection localized to the point of inoculation for the ΔFgatg8 mutant.
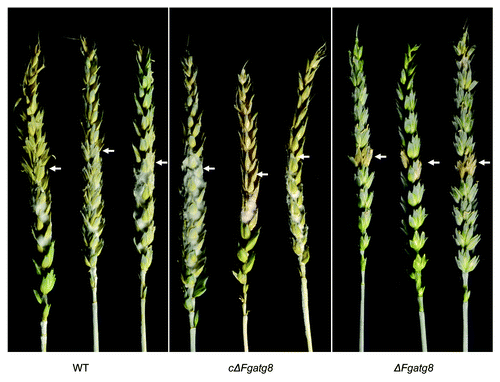
Figure 11. Wheat spikes 21 d after point inoculation. Arrows indicate infection localized to the point of inoculation for the ΔFgatg8 mutant.

Table 2. Primers used for cloning and result validation. Underline in the primers indicates specific overhangs containing a single 2-deoxyuridine nucleoside or added restriction sites.

Figure S1. Colonies on DFM agar 6 d after plug transfer. Incubated at 22°C. Colonies are photographed sideways to show the limited development of the aerial mycelium in the deletion mutants and the restoration of it in the complemented strains. Petri dishes = 9 cm diameter. For explanation of the strains see .
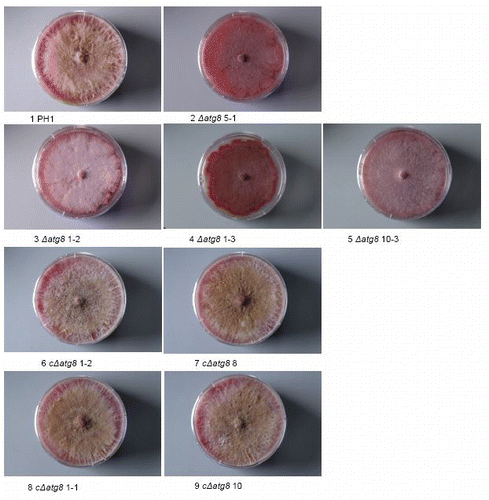
Figure S1. Colonies on DFM agar 6 d after plug transfer. Incubated at 22°C. Colonies are photographed sideways to show the limited development of the aerial mycelium in the deletion mutants and the restoration of it in the complemented strains. Petri dishes = 9 cm diameter. For explanation of the strains see Table S1.

Figure S2. Colonies grown on DFM agar 26 d after plug transfer. Incubated at 22°C. Colonies are side. lit to show the limited development of the aerial mycelium in the deletion mutants and the restoration of it in the complemented strains. Petri dishes = 9 cm diameter. For explanation of the strains see .
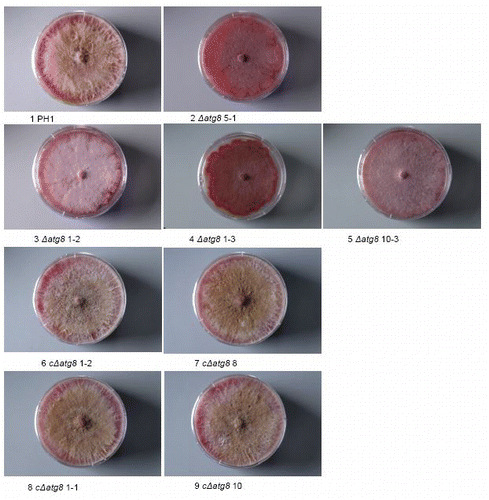
Figure S2. Colonies grown on DFM agar 26 d after plug transfer. Incubated at 22°C. Colonies are side. lit to show the limited development of the aerial mycelium in the deletion mutants and the restoration of it in the complemented strains. Petri dishes = 9 cm diameter. For explanation of the strains see Table S1.

Figure S3. Aerial mycelium development on 18 × 18 mm (image size) cover glasses inserted in DFM agar (bottom part without aerial mycelium) after 4 d of growth. For explanation of the strains see .
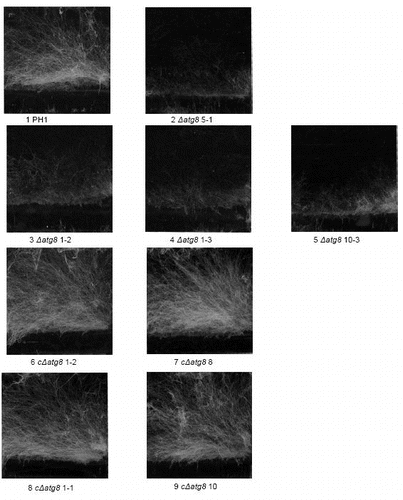
Figure S3. Aerial mycelium development on 18 × 18 mm (image size) cover glasses inserted in DFM agar (bottom part without aerial mycelium) after 4 d of growth. For explanation of the strains see Table S1.

Figure S4. Lipid droplet formation in the aerial mycelium growing on cover glasses after 4 d. Stain = HCS LipidTOX Red. DIC image (left) showing the mycelium and right the corresponding section seen by fluorescence mycroscopy. The fluorescence images were exposed the same length of time and the resulting digital images treated in exactly the same way. Size bars = 20 μm. For explanation of the strains see .
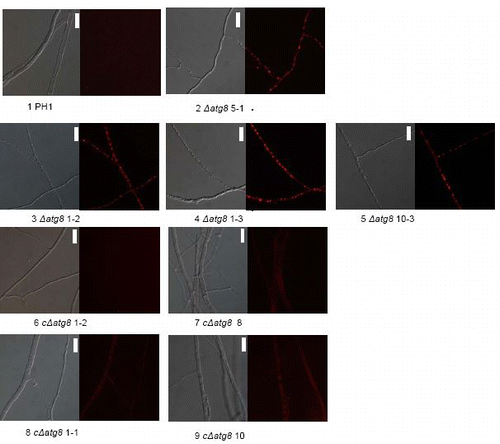
Figure S4. Lipid droplet formation in the aerial mycelium growing on cover glasses after 4 d. Stain = HCS LipidTOX Red. DIC image (left) showing the mycelium and right the corresponding section seen by fluorescence mycroscopy. The fluorescence images were exposed the same length of time and the resulting digital images treated in exactly the same way. Size bars = 20 μm. For explanation of the strains see Table S1.

Figure S5. Growth over inert plastic surface 3 d after plug transfer incubated at 22°C in moist chamber. Petri dishes = 9 cm diameter. For explanation of the strains see .
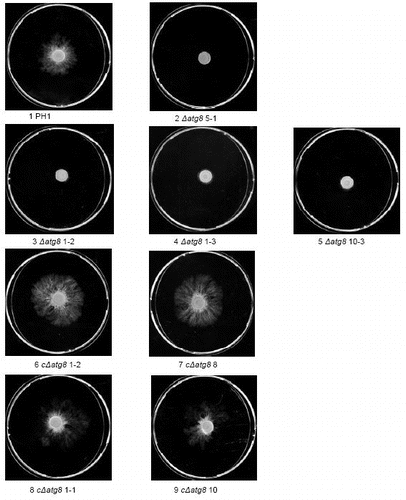
Figure S5. Growth over inert plastic surface 3 d after plug transfer incubated at 22°C in moist chamber. Petri dishes = 9 cm diameter. For explanation of the strains see Table S1.

Figure S6. Radial extension measurements by determining the area of plastic colonized after 3 d on a plastic surface from images like in and then calculating what radial growth is needed to produce a completely circular colony with the same area. Error bars = SEM. For strain No explanation see slide 1.
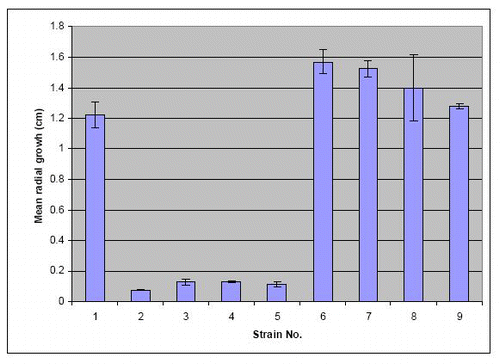
Figure S6. Radial extension measurements by determining the area of plastic colonized after 3 d on a plastic surface from images like in Figure S3 and then calculating what radial growth is needed to produce a completely circular colony with the same area. Error bars = SEM. For strain No explanation see slide 1.

Figure S7. Preparation of fungal race pipettes showing the new techniques. Pipettes just poured and capped with sterile Eppendorf tubes (A). Inoculation of pipettes with the aid of a sterile toothpick (B). The final capped tube with capping Eppendorph tube secured with cello tape (C) (lid cut off the tube). Race pipette after incubation and readings (D) (markings were mainly done on the underside of this pipette).
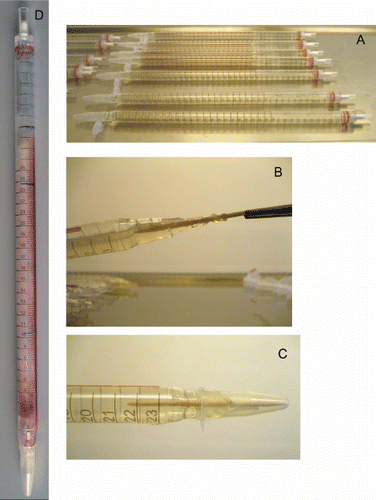
Figure S7. Preparation of fungal race pipettes showing the new techniques. Pipettes just poured and capped with sterile Eppendorf tubes (A). Inoculation of pipettes with the aid of a sterile toothpick (B). The final capped tube with capping Eppendorph tube secured with cello tape (C) (lid cut off the tube). Race pipette after incubation and readings (D) (markings were mainly done on the underside of this pipette).

Table S1. Key to strain codes used in supplement compared with in the article. The codes of the three strains referred to in the article are in brackets

Supplemental material

Additional material

Download Zip (1.6 MB)

Reprints and Corporate Permissions

Please note: Selecting permissions does not provide access to the full text of the article, please see our help page How do I view content?

To request a reprint or corporate permissions for this article, please click on the relevant link below:

Academic Permissions

Please note: Selecting permissions does not provide access to the full text of the article, please see our help page How do I view content?

Obtain permissions instantly via Rightslink by clicking on the button below:

If you are unable to obtain permissions via Rightslink, please complete and submit this Permissions form. For more information, please visit our Permissions help page.