2,860
Views
51
CrossRef citations to date
0
Altmetric
Basic Research Paper

Autophagy inhibition promotes defective neosynthesized proteins storage in ALIS, and induces redirection toward proteasome processing and MHCI-restricted presentation

, , , , , , , , , , & show all
Pages 350-363 | Received 09 Sep 2011, Accepted 18 Nov 2011, Published online: 01 Mar 2012

Figures & data

Figure 1. ALIS form upon autophagy inhibition, and differ from proteasome inhibition-induced aggregates. (A) HeLa cells were treated for 4 h with 3-MA (5 mM) or left untreated (control) and stained for polyubiquitinated proteins (FK1 antibody, polyUbi, green), NBR1 (red) and p62 (blue) prior to analysis by confocal microscopy. (B) HeLa cells were treated for 4 h with 3-MA (5 mM), Puromycin (5 µg/ml) or Epoxomycin (5 µM). Cells were stained for ubiquitinated protein (FK2 antibody, polyUbi, blue), HSPA8 (green), and p62 (red). Arrowheads indicate ALIS in the overlay and the corresponding area in the HSPA8 staining, respectively. Pearson’s coefficient (R) is given for the colocalization of p62 and HSPA8. (C) HeLa cells were transfected with siRNA against ATG5 (siATG5) or control siRNA (siCo) and stained for ubiquitinated protein (FK2 antibody, polyUbi, blue), HSPA8 (green) and p62 (red). Bar, 10 µm.
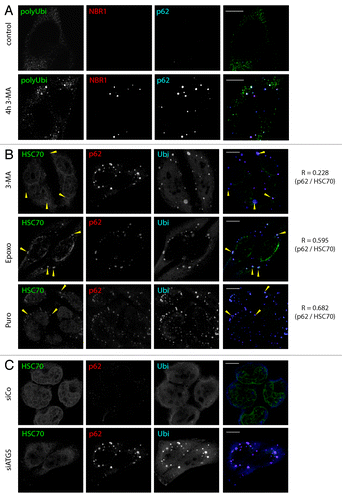
Figure 1. ALIS form upon autophagy inhibition, and differ from proteasome inhibition-induced aggregates. (A) HeLa cells were treated for 4 h with 3-MA (5 mM) or left untreated (control) and stained for polyubiquitinated proteins (FK1 antibody, polyUbi, green), NBR1 (red) and p62 (blue) prior to analysis by confocal microscopy. (B) HeLa cells were treated for 4 h with 3-MA (5 mM), Puromycin (5 µg/ml) or Epoxomycin (5 µM). Cells were stained for ubiquitinated protein (FK2 antibody, polyUbi, blue), HSPA8 (green), and p62 (red). Arrowheads indicate ALIS in the overlay and the corresponding area in the HSPA8 staining, respectively. Pearson’s coefficient (R) is given for the colocalization of p62 and HSPA8. (C) HeLa cells were transfected with siRNA against ATG5 (siATG5) or control siRNA (siCo) and stained for ubiquitinated protein (FK2 antibody, polyUbi, blue), HSPA8 (green) and p62 (red). Bar, 10 µm.

Figure 2. Puromycin DRiPs are autophagy substrates. (A) HeLa cells were treated for 4 h with 3-MA (4 h 3-MA), and puromycin (0,1 µg/µl) was added for the last 5 min (4 h 3MA + 5 min Puro). Cells were Triton X-100 permeabilized prior to fixation, and stained for ubiquitinylated protein (FK2 antibody, polyUbi, red), p62 (blue), and puromycin-containing proteins (Puro, green). Bar, 10 µm. (B) Hela cells received a short pulse of puromycin (10 min, 0.1 µg/ml), were washed and chased in the absence of puromycin in the presence or absence of proteasome inhibitor or 3-MA for the indicated times. Puromycin containing protein was resolved by SDS-PAGE and detected using anti-puromycin antibodies (top) and quantified using ImageJ (bottom), mean ± SEM from three independent experiments are shown, p values (Student’s t-test) were **p > 0.03. (C) Hela cells were stained for ubiquitinylated protein (FK1 antibody, polyUbi, green) and LC3 (red). Bar, 10 µm. (D) HeLa cells were left untreated, or treated for 30 min with puromycin (0.1 µg/µl), and stained for LC3 (red), p62 (blue) and puromycin-containing proteins (Puro, green). Bar, 10 µm.
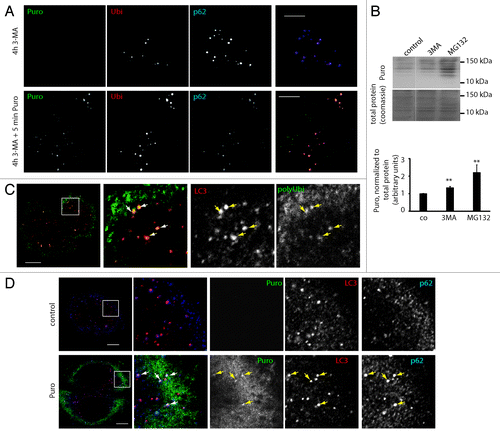
Figure 2. Puromycin DRiPs are autophagy substrates. (A) HeLa cells were treated for 4 h with 3-MA (4 h 3-MA), and puromycin (0,1 µg/µl) was added for the last 5 min (4 h 3MA + 5 min Puro). Cells were Triton X-100 permeabilized prior to fixation, and stained for ubiquitinylated protein (FK2 antibody, polyUbi, red), p62 (blue), and puromycin-containing proteins (Puro, green). Bar, 10 µm. (B) Hela cells received a short pulse of puromycin (10 min, 0.1 µg/ml), were washed and chased in the absence of puromycin in the presence or absence of proteasome inhibitor or 3-MA for the indicated times. Puromycin containing protein was resolved by SDS-PAGE and detected using anti-puromycin antibodies (top) and quantified using ImageJ (bottom), mean ± SEM from three independent experiments are shown, p values (Student’s t-test) were **p > 0.03. (C) Hela cells were stained for ubiquitinylated protein (FK1 antibody, polyUbi, green) and LC3 (red). Bar, 10 µm. (D) HeLa cells were left untreated, or treated for 30 min with puromycin (0.1 µg/µl), and stained for LC3 (red), p62 (blue) and puromycin-containing proteins (Puro, green). Bar, 10 µm.

Figure 3. ALIS contain different linkage type polyubiquitin, and form independently of NRF2 signaling and general transcription. (A) HeLa cells were treated for 4 h with 3-MA and stained for the indicated ubiquitin linkage type (K48 and K62 polyUbi, green) and p62 (red). (B) HeLa cells were treated or not for 4 h with 3-MA (top), or transfected with siRNA against ATG5 (siATG5) or nontargeting siRNA (siCo), and qPCR for the indicated genes was carried (mean ± SEM from three independent experiments). (C) HeLa cells were treated or not for 4 h with 3-MA in the presence or absence of Actinomycin D. Cells were stained for ubiquitinated protein (FK2 antibody, polyUbi, green) and p62 (red). Bar, 10 µm.
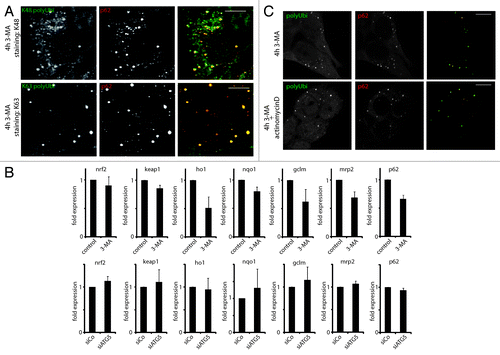
Figure 3. ALIS contain different linkage type polyubiquitin, and form independently of NRF2 signaling and general transcription. (A) HeLa cells were treated for 4 h with 3-MA and stained for the indicated ubiquitin linkage type (K48 and K62 polyUbi, green) and p62 (red). (B) HeLa cells were treated or not for 4 h with 3-MA (top), or transfected with siRNA against ATG5 (siATG5) or nontargeting siRNA (siCo), and qPCR for the indicated genes was carried (mean ± SEM from three independent experiments). (C) HeLa cells were treated or not for 4 h with 3-MA in the presence or absence of Actinomycin D. Cells were stained for ubiquitinated protein (FK2 antibody, polyUbi, green) and p62 (red). Bar, 10 µm.

Figure 4. ALIS are dynamic structures forming upon autophagy inhibition and turning over by the proteasome. (A) HeLa cells were treated for 2 h or 6 h with 3-MA (2 h 3-MA / 6 h 3-MA), washed and left for further 4 h without drug (2 h 3-MA / 4 h chase), or were treated for 2 h with 3-MA and for the next 4 h, cycloheximide (CHX) was added (2 h 3-MA / 4 h 3-MA + CHX). Cells were Triton X-100 permeabilized prior to fixation, and stained for ALIS (p62 and FK2 polyubiquitin antibody) and nuclei (TOPRO-3). Cells were scored for the presence of ALIS (p62 and polyubiquitin double-positive structures outside the nucleus), mean and SEM of three independent experiments (right). (B) HeLa cells were treated for a total of 2 h or 6 h with 3-MA and received a 15 min-pulse of 0.1 µg/µl puromycin after the first hour (2 h 3MA/puro-pulse after 1 h and 6 h 3-MA / puro-pulse after 1 h, respectively), or were treated for 2 h with 3-MA (receiving a 15 min-puro-pulse after 1 h), washed and then treated for the remaining 4 h with Epoxomycin (2 h 3-MA / 4 h chase Epox / puro-pulse after 1 h). Cells were Triton X-100 permeabilized, fixed and stained for polyubiquitinylated protein (FK2 antibody, polyUbi, green), p62 (red) and puromycin-containing proteins (Puro, blue). Treatment schemes are represented at the bottom of the images. (C) Hela cells expressing mCherry-GFP-LC3 were left untreated (control), or treated with 3-MA for 2 h (2 h 3-MA), or treated with 3-MA for 2 h followed by a 4 h chase in the presence (2 h 3-MA + chase Epox) or absence (2 h 3-MA + chase) of epoxomycin. Autophagosome formation and acidification was monitored by confocal microscopy of eGFP and mCherry fluorescence. Treatment schemes are represented at the bottom of the images. All images are representative for at least three independent experiments. Bar, 10 µm.
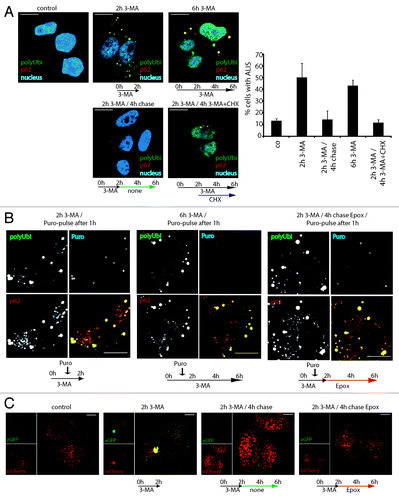
Figure 4. ALIS are dynamic structures forming upon autophagy inhibition and turning over by the proteasome. (A) HeLa cells were treated for 2 h or 6 h with 3-MA (2 h 3-MA / 6 h 3-MA), washed and left for further 4 h without drug (2 h 3-MA / 4 h chase), or were treated for 2 h with 3-MA and for the next 4 h, cycloheximide (CHX) was added (2 h 3-MA / 4 h 3-MA + CHX). Cells were Triton X-100 permeabilized prior to fixation, and stained for ALIS (p62 and FK2 polyubiquitin antibody) and nuclei (TOPRO-3). Cells were scored for the presence of ALIS (p62 and polyubiquitin double-positive structures outside the nucleus), mean and SEM of three independent experiments (right). (B) HeLa cells were treated for a total of 2 h or 6 h with 3-MA and received a 15 min-pulse of 0.1 µg/µl puromycin after the first hour (2 h 3MA/puro-pulse after 1 h and 6 h 3-MA / puro-pulse after 1 h, respectively), or were treated for 2 h with 3-MA (receiving a 15 min-puro-pulse after 1 h), washed and then treated for the remaining 4 h with Epoxomycin (2 h 3-MA / 4 h chase Epox / puro-pulse after 1 h). Cells were Triton X-100 permeabilized, fixed and stained for polyubiquitinylated protein (FK2 antibody, polyUbi, green), p62 (red) and puromycin-containing proteins (Puro, blue). Treatment schemes are represented at the bottom of the images. (C) Hela cells expressing mCherry-GFP-LC3 were left untreated (control), or treated with 3-MA for 2 h (2 h 3-MA), or treated with 3-MA for 2 h followed by a 4 h chase in the presence (2 h 3-MA + chase Epox) or absence (2 h 3-MA + chase) of epoxomycin. Autophagosome formation and acidification was monitored by confocal microscopy of eGFP and mCherry fluorescence. Treatment schemes are represented at the bottom of the images. All images are representative for at least three independent experiments. Bar, 10 µm.

Figure 5. Autophagy targeted DRiPs can be re-targeted to the proteasome upon autophagy inhibition, increasing MHCI presentation. HSPA8, BAG-3 and BAG-6 are important for GFP DRiPs processing. (A) iHela model cell line: schematic representation of the constitutive expression cassettes for H-2Kb and rtTA, and the inducible model antigen expression cassette, consisting of the TRE promoter and eGFP-SL8 (left). FACS analysis of GFP-SL8 expression and SL8 presentation on H-2Kb (25D1.16) in iHeLa cells upon doxycycline treatment for 16 h (right). (B) iHeLa cells were induced with doxycycline for 6 h and treated (arrow) with MG132 or cycloheximide (CHX), and analyzed for GFP-SL8 expression (left) and Kb/SL8 complexes appearance with the 25-D1.16 antibody staining (right) at the indicated time. (C) iHeLa cells were induced for 6 h, treated with 3-MA alone or in combination with CHX (arrow), and analyzed for GFP-SL8 expression (left) and Kb/SL8 complexes appearance with the 25-D1.16 antibody staining (right) at the indicated time. In (B and C), representative result from at least four independent experiments is shown. (D) iHeLa cells were transfected either with control siRNA (si co), or siRNAs directed against Atg5 (siATG5) or Beclin 1 (siBeclin 1). Forty-eight hours after transfection of indicated siRNA, cells were induced for 16 h and analyzed Kb/SL8 surface appearance (left) and for GFP-SL8 expression (right). Mean ± SEM from at least four independent experiments are shown, p values (Student’s t-test) were **p < 0.001, *p < 0.03. (E) iHeLa cells were transfected either with control siRNA (si co) or siRNAs directed against HSPA8 (HSPA8). Forty-eight hours after transfection, cells were induced for 16 h and analyzed Kb/SL8 surface appearance (left) and for GFP-SL8 expression (right). Mean ± SEM from at least four independent experiments are shown, p values (Student’s t-test) were *p < 0.03. (F) iHeLa cells were transfected either with control siRNA (si co), or siRNAs directed against CHIP (siCHIP), BAG-1 (siBAG-1), BAG-3 (siBAG-3) or BAG-6 (siBAG-6). Forty-eight hours after transfection of indicated siRNA, cells were induced for 16 h and analyzed Kb/SL8 surface appearance (left) and for GFP-SL8 expression (right). Mean ± SEM from at least four independent experiments are shown, p values (Student’s t-test) were *p < 0.03.
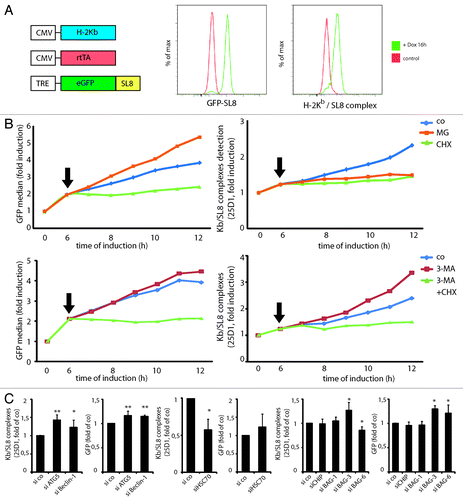
Figure 5. Autophagy targeted DRiPs can be re-targeted to the proteasome upon autophagy inhibition, increasing MHCI presentation. HSPA8, BAG-3 and BAG-6 are important for GFP DRiPs processing. (A) iHela model cell line: schematic representation of the constitutive expression cassettes for H-2Kb and rtTA, and the inducible model antigen expression cassette, consisting of the TRE promoter and eGFP-SL8 (left). FACS analysis of GFP-SL8 expression and SL8 presentation on H-2Kb (25D1.16) in iHeLa cells upon doxycycline treatment for 16 h (right). (B) iHeLa cells were induced with doxycycline for 6 h and treated (arrow) with MG132 or cycloheximide (CHX), and analyzed for GFP-SL8 expression (left) and Kb/SL8 complexes appearance with the 25-D1.16 antibody staining (right) at the indicated time. (C) iHeLa cells were induced for 6 h, treated with 3-MA alone or in combination with CHX (arrow), and analyzed for GFP-SL8 expression (left) and Kb/SL8 complexes appearance with the 25-D1.16 antibody staining (right) at the indicated time. In (B and C), representative result from at least four independent experiments is shown. (D) iHeLa cells were transfected either with control siRNA (si co), or siRNAs directed against Atg5 (siATG5) or Beclin 1 (siBeclin 1). Forty-eight hours after transfection of indicated siRNA, cells were induced for 16 h and analyzed Kb/SL8 surface appearance (left) and for GFP-SL8 expression (right). Mean ± SEM from at least four independent experiments are shown, p values (Student’s t-test) were **p < 0.001, *p < 0.03. (E) iHeLa cells were transfected either with control siRNA (si co) or siRNAs directed against HSPA8 (HSPA8). Forty-eight hours after transfection, cells were induced for 16 h and analyzed Kb/SL8 surface appearance (left) and for GFP-SL8 expression (right). Mean ± SEM from at least four independent experiments are shown, p values (Student’s t-test) were *p < 0.03. (F) iHeLa cells were transfected either with control siRNA (si co), or siRNAs directed against CHIP (siCHIP), BAG-1 (siBAG-1), BAG-3 (siBAG-3) or BAG-6 (siBAG-6). Forty-eight hours after transfection of indicated siRNA, cells were induced for 16 h and analyzed Kb/SL8 surface appearance (left) and for GFP-SL8 expression (right). Mean ± SEM from at least four independent experiments are shown, p values (Student’s t-test) were *p < 0.03.

Figure 6. GFP-SL8 DRiPs are autophagy substrates, and full-length but misfolded GFP-SL8 accumulates in ALIS. (A) iHela cells were induced with doxycyclin (1 µg/ml) for 12 h and treated for further 4 h with 3-MA. Cells were analyzed Kb/SL8 surface appearance (left) and for GFP-SL8 expression (right). Mean ± SEM from seven independent experiments are shown, p values (Student’s t-test) were **p < 0.01. (B) iHela cells were induced with doxycyclin (1 µg/ml) for 12 h and treated for further 4 h with MG132 or 3-MA. GFP levels were assessed by western blot in both the Triton X-100 soluble extracts (25 µg protein) and in total protein (5 × 10⁴ cells) (bottom). GFP levels were quantified using ImageJ (top, expressed as relative units, normalized to the respective actin control), p values (Student’s t-test) were **p < 0.03. (C) iHeLa cells induced for 16 h prior to treatment with 3-MA (4 h) were permeabilized to remove soluble GFP-SL8, and then fixed. Cells were subsequently analyzed for GFP direct fluorescence, and stained for GFP-SL8 (SL8) and p62 (left), or additionally for total GFP protein localization by anti-GFP antibody staining (right). Scale bar, 10 µm.
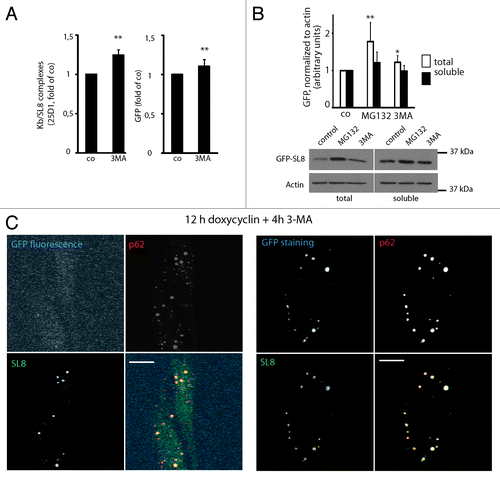
Figure 6. GFP-SL8 DRiPs are autophagy substrates, and full-length but misfolded GFP-SL8 accumulates in ALIS. (A) iHela cells were induced with doxycyclin (1 µg/ml) for 12 h and treated for further 4 h with 3-MA. Cells were analyzed Kb/SL8 surface appearance (left) and for GFP-SL8 expression (right). Mean ± SEM from seven independent experiments are shown, p values (Student’s t-test) were **p < 0.01. (B) iHela cells were induced with doxycyclin (1 µg/ml) for 12 h and treated for further 4 h with MG132 or 3-MA. GFP levels were assessed by western blot in both the Triton X-100 soluble extracts (25 µg protein) and in total protein (5 × 10⁴ cells) (bottom). GFP levels were quantified using ImageJ (top, expressed as relative units, normalized to the respective actin control), p values (Student’s t-test) were **p < 0.03. (C) iHeLa cells induced for 16 h prior to treatment with 3-MA (4 h) were permeabilized to remove soluble GFP-SL8, and then fixed. Cells were subsequently analyzed for GFP direct fluorescence, and stained for GFP-SL8 (SL8) and p62 (left), or additionally for total GFP protein localization by anti-GFP antibody staining (right). Scale bar, 10 µm.

Figure 7. NBR1 is required for DRiPs targeting to autophagy, while p62 is required for aggregation. (A) iHeLa cells were transfected either with control siRNA (si co), or siRNAs directed against NBR1 (siNBR1), p62 (sip62) or ATG5 (siATG5). Forty-eight hours after transfection of indicated siRNA, cells were induced for 16 h and analyzed Kb/SL8 surface appearance (left) and for GFP-SL8 expression (right). Mean ± SEM from at least four independent experiments are shown, p values (Student’s t-test) were *p < 0.03, **p < 0.001. (B) Cells were transfected with indicated siRNA as above (left), and treated or not with 3-MA for 4 h. Aggregates were visualized by polyubiquitin (FK2 antibody, polyUbi, green) and p62 (red) staining. (C) iHeLa cells were transfected either with control siRNA (si co), or siRNAs directed against ATG5 (siATG5) or NBR1 (siNBR1), alone or in combination with siRNA against p62. Forty-eight hours after transfection of indicated siRNA, cells were induced for 16 h and analyzed Kb/SL8 surface appearance (left) and for GFP-SL8 expression (right). Mean ± SEM from at least four independent experiments are shown. (D) Cells were transfected with indicated siRNA (left), and treated or not with 3-MA for 4 h. Aggregates were visualized by polyubiquitin staining and confocal microscopy.
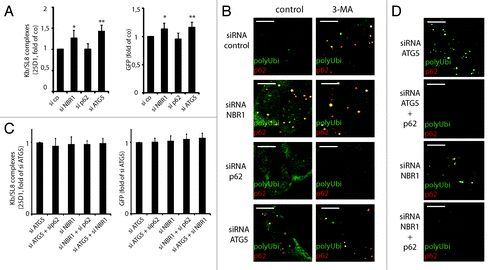
Figure 7. NBR1 is required for DRiPs targeting to autophagy, while p62 is required for aggregation. (A) iHeLa cells were transfected either with control siRNA (si co), or siRNAs directed against NBR1 (siNBR1), p62 (sip62) or ATG5 (siATG5). Forty-eight hours after transfection of indicated siRNA, cells were induced for 16 h and analyzed Kb/SL8 surface appearance (left) and for GFP-SL8 expression (right). Mean ± SEM from at least four independent experiments are shown, p values (Student’s t-test) were *p < 0.03, **p < 0.001. (B) Cells were transfected with indicated siRNA as above (left), and treated or not with 3-MA for 4 h. Aggregates were visualized by polyubiquitin (FK2 antibody, polyUbi, green) and p62 (red) staining. (C) iHeLa cells were transfected either with control siRNA (si co), or siRNAs directed against ATG5 (siATG5) or NBR1 (siNBR1), alone or in combination with siRNA against p62. Forty-eight hours after transfection of indicated siRNA, cells were induced for 16 h and analyzed Kb/SL8 surface appearance (left) and for GFP-SL8 expression (right). Mean ± SEM from at least four independent experiments are shown. (D) Cells were transfected with indicated siRNA (left), and treated or not with 3-MA for 4 h. Aggregates were visualized by polyubiquitin staining and confocal microscopy.
Supplemental material

Additional material

Download Zip (553.3 KB)

Reprints and Corporate Permissions

Please note: Selecting permissions does not provide access to the full text of the article, please see our help page How do I view content?

To request a reprint or corporate permissions for this article, please click on the relevant link below:

Academic Permissions

Please note: Selecting permissions does not provide access to the full text of the article, please see our help page How do I view content?

Obtain permissions instantly via Rightslink by clicking on the button below:

If you are unable to obtain permissions via Rightslink, please complete and submit this Permissions form. For more information, please visit our Permissions help page.