Figures & data
Figure 1. Effect of serum- and AA-withdrawal on autophagosome formation in trout myoblasts. Four-day-old cells were incubated in a serum- and amino acid-rich (complete medium, CM) or -deprived medium (minimal medium, MM) with or without bafilomycin A1 (Baf A1). (A) Immunolocalization of LC3B (green) was performed after 4 h incubation as described in Materials and Methods. Nuclei were stained with Hoescht (blue). Graph represents the quantification of the number of LC3 puncta per cell. Results are expressed as means ± SEM, n = 4–5 (mean of 4–5 replications) and were analyzed by one-way ANOVA followed by Student Newman–Keuls test for multiple comparison (p < 0.05). Different letters represent significantly different values. (B) After 4 h incubation, cell lysates (10 µg) were analyzed by western blot with an anti-LC3B antibody. β-actin was used as loading control. The ratio of LC3-II to β-actin is shown quantitatively as a graph. (C) Cells were incubated in a serum- and amino acid-rich (complete medium, CM) or -deprived medium (minimal medium, MM) for 0.5, 2, 4, 6, 12, 24 h. Cell lysates (10 µg) were analyzed by western blot with the indicated antibodies. A representative blot is shown. Graphs represent the ratio of LC3-II to β-actin. Results are means ± SEM, n = 3 (mean of 3 replications) and were analyzed using one way ANOVA followed by the Student Newman–Keuls test for multiple comparisons (p < 0.05). Different letters represent significantly different values.
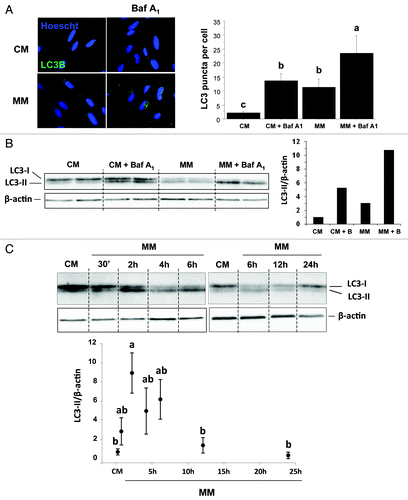
Figure 2. Effect of serum- and AA-withdrawal on autophagy-related gene expression in trout myoblasts. Four-day-old cells were incubated in a serum- and amino acid-rich (complete medium, CM) or -deprived medium (minimal medium, MM) for 1, 2.5, 4, 8 or 24 h. Gabarapl1, LC3B, atg4b and atg12l mRNA levels were estimated using real-time RT-PCR. Expression values were normalized with elongation factor 1α (EF1α)-expressed transcripts. Results are expressed as means ± SEM, (n = 3 independent experiments, each the mean of 6 replications) and were analyzed by one-way ANOVA followed by Student Newman–Keuls test for multiple comparison (p < 0.05). Means not sharing the same letter are significantly different.
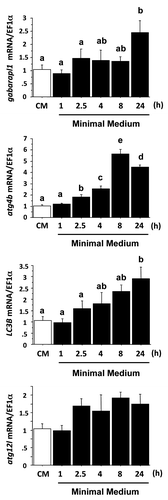
Figure 3. Effect of AA on autophagy-related gene expression in trout myoblasts. Four-day-old cells were incubated in a serum- and amino acid-rich (complete medium, CM) or -deprived medium (minimal medium, MM) for 1 h. The minimal medium was then replaced for 24 h with an amino acid-free (MM) or amino acids (AA)-containing medium (MEM essential and nonessential AA mixtures). LC3B, gabarapl1, atg12l and atg4b mRNA levels were estimated using real-time RT-PCR. Expression values were normalized with elongation factor 1α (EF1α)-expressed transcripts. Results are expressed as means ± SEM, (n = 3 independent experiments, each the mean of 6 replications) and were analyzed by one-way ANOVA followed by Student Newman–Keuls test for multiple comparison (p < 0.05). Different letters represent significantly different values.
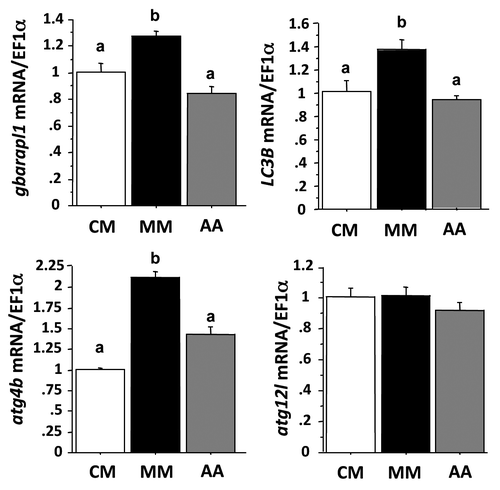
Figure 4. Effect of AA on the phosphorylation of S6, 4E-BP1, eIF2α, FoxO1 and FoxO3a proteins in trout myoblasts. (A) Four-day cultivated cells were incubated in a serum- and AA-deprived medium for 1 h. Afterwards, the culture medium was replaced with a serum- and AA-rich medium (complete medium group, CM), a serum- and AA-free medium (minimal medium group, MM) or a medium containing amino acids (Amino acids group AA) for 30 min before harvest. Cell lysates (10µg) were analyzed by western blot with the indicated antibodies. A representative blot is shown. Graphs represent the ratio between the phosphorylated protein and the total amount of the targeted protein. For FoxO proteins, filled and dashed columns represent FoxO1 and FoxO3a, respectively. Results are means ± SEM, n = 3 (mean of 3 replications) and were analyzed using one way ANOVA followed by the Student Newman–Keuls test for multiple comparisons (p < 0.05). Different letters represent significantly different values. (B) Immunolocalization of FoxO1 (red) was performed as described in Materials and Methods. Nuclei were stained with Hoescht (blue).
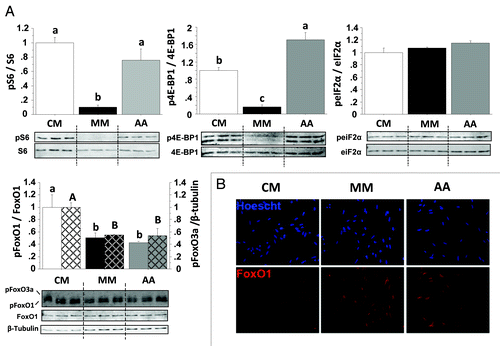
Figure 5. Effect of AA with or without rapamycin on the phosphorylation of S6, 4E-BP1, eIF2α, FoxO1 and FoxO3a proteins in trout myoblasts. Four-day cultivated cells were incubated in a serum- and AA-deprived medium for 30 min and then preincubated for 30 min with or without 100 nM rapamycin. Afterwards, the culture mediums were replaced for 30 min with a serum- and AA-rich medium (complete medium group, CM), a serum- and AA-free medium (minimal medium group, MM; rapamycin group, R) or a medium containing amino acids (amino acids group AA and amino acids plus rapamycin group AAR). Cell lysates (10 µg) were analyzed by western blot with the indicated antibodies. A representative blot is shown. Graphs represent the ratio between the phosphorylated protein and the total amount of the targeted protein. For FoxO proteins, filled and dashed columns represent FoxO1 and FoxO3a, respectively. Results are means ± SEM, n = 3 (mean of 3 replications) and were analyzed using one way ANOVA followed by the Student Newman–Keuls test for multiple comparisons (p < 0.05). Different letters represent significantly different values.
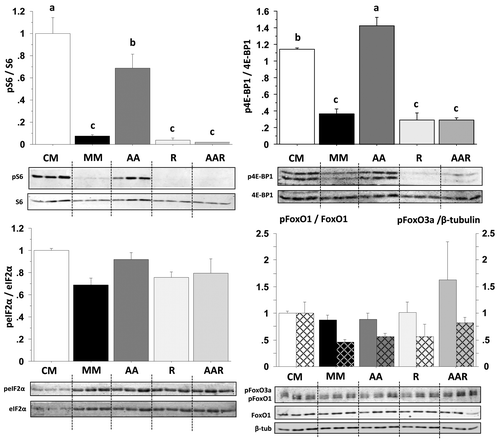
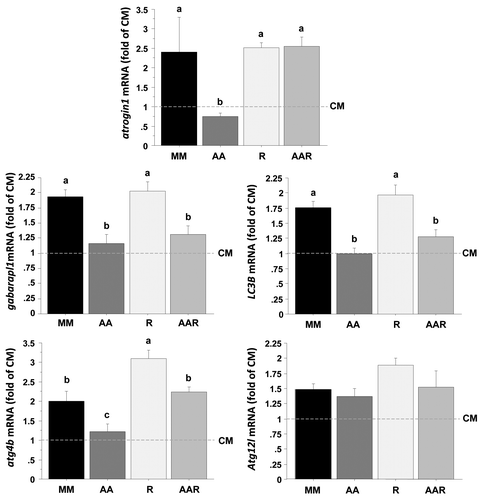
Figure 6. Effect of AA with or without rapamycin on the expression of several autophagy-related genes in trout myoblasts. Four-day cultivated cells were incubated in a serum- and AA-deprived medium for 30 min and then preincubated for 30 min with or without 100 nM rapamycin. Afterwards, the culture mediums were replaced for 24 h with a serum- and AA-rich medium (complete medium group, CM), a serum- and AA-free medium (minimal medium group, MM; rapamycin group, R) or a medium containing amino acids (amino acids group AA and amino acids plus rapamycin group AAR). Atrogin1, LC3B, gabarapl1, atg12l and atg4b mRNA levels were estimated using real-time RT-PCR. For each treatment, six replicates were performed. Expression values were normalized with Rps29 expressed transcripts. Results are expressed as fold of the CM group and presented as means ± SEM, n = 6 (mean of 6 replications). They were analyzed by one-way ANOVA followed by Student Newman–Keuls test for multiple comparison (p < 0.05). Different letters represent significantly different values.