907
Views
23
CrossRef citations to date
0
Altmetric
Basic Brief Report

Autophagy proteins play cytoprotective and cytocidal roles in leucine starvation-induced cell death in Saccharomyces cerevisiae

&
Pages 731-738 | Received 29 Sep 2011, Accepted 10 Jan 2012, Published online: 24 Feb 2012

Figures & data

Figure 1. Autophagy mutants did not respond uniformly to nutrient deprivation. (A and D) BY4741 and its derivatives bearing deletions of the indicated genes were transformed with a vector, YEp,Citation25 and grown in SD medium to an OD600nm of approximately 0.4, harvested, washed, and then diluted to 0.04 OD600nm using either SD-leucine (SD-L) or SD-nitrogen sources (SD-N) as described in Materials and Methods. Samples were removed every 12 h (SD-L) or 72 h (SD-N), plated onto YPD medium and incubated 2 d at 30°C to assay for survivors. This recovery was normalized to the number of survivors at 0 h. Each point is the average and standard deviation of 3–4 experiments. (B–C and E–F) Cells were removed from each culture after 12 h (SD-L) and 24 h (SD-N) starvation, cell wall-permeabilized, treated simultaneously with PI and annexin V, and viewed microscopically at 520 nm (annexin-FITC) and 620 nm (PI).Citation13 Each value is the average percentage (and standard deviation) of stained cells within a population of 100–200 cells based on 3–4 independent experiments. Results are grouped into two sets: the black bar shows cells staining with annexin V alone (interpreted as undergoing apoptosis), and the white and gray bars show cells staining with PI or PI and annexin (interpreted as undergoing different forms of necrosis). *The CFA (the percentage of cells surviving relative to the initial cell number) at the time of sampling is shown below each mutant. The classification noted at the top of (C and F) indicates how the CFA of each strain was scored 13 when grown on 13 mM Zn2+.
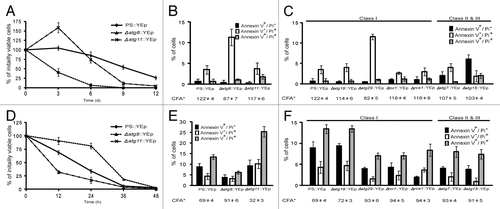
Figure 1. Autophagy mutants did not respond uniformly to nutrient deprivation. (A and D) BY4741 and its derivatives bearing deletions of the indicated genes were transformed with a vector, YEp,Citation25 and grown in SD medium to an OD600nm of approximately 0.4, harvested, washed, and then diluted to 0.04 OD600nm using either SD-leucine (SD-L) or SD-nitrogen sources (SD-N) as described in Materials and Methods. Samples were removed every 12 h (SD-L) or 72 h (SD-N), plated onto YPD medium and incubated 2 d at 30°C to assay for survivors. This recovery was normalized to the number of survivors at 0 h. Each point is the average and standard deviation of 3–4 experiments. (B–C and E–F) Cells were removed from each culture after 12 h (SD-L) and 24 h (SD-N) starvation, cell wall-permeabilized, treated simultaneously with PI and annexin V, and viewed microscopically at 520 nm (annexin-FITC) and 620 nm (PI).Citation13 Each value is the average percentage (and standard deviation) of stained cells within a population of 100–200 cells based on 3–4 independent experiments. Results are grouped into two sets: the black bar shows cells staining with annexin V alone (interpreted as undergoing apoptosis), and the white and gray bars show cells staining with PI or PI and annexin (interpreted as undergoing different forms of necrosis). *The CFA (the percentage of cells surviving relative to the initial cell number) at the time of sampling is shown below each mutant. The classification noted at the top of (C and F) indicates how the CFA of each strain was scored 13 when grown on 13 mM Zn2+.

Table 1. Rapamycin reduces the symptoms of death during leucine starvation

Figure 2. Expressing GFP-Atg8 in PS cells changed the percentages of cells dying during starvation. PS and Δatg8 cells were transformed with YEp or a plasmid expressing GFP-Atg8, starved and stained with PI, and scored. Because of the presence of GFP, it was not possible to score for annexin V-staining cells in these experiments. Each average (and standard deviation) was derived from 3–4 independent experiments, each counting 100–200 cells. The table shows the CFA of each strain at the time of sampling.
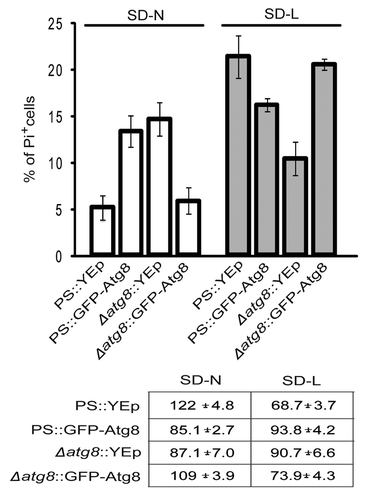
Figure 2. Expressing GFP-Atg8 in PS cells changed the percentages of cells dying during starvation. PS and Δatg8 cells were transformed with YEp or a plasmid expressing GFP-Atg8, starved and stained with PI, and scored. Because of the presence of GFP, it was not possible to score for annexin V-staining cells in these experiments. Each average (and standard deviation) was derived from 3–4 independent experiments, each counting 100–200 cells. The table shows the CFA of each strain at the time of sampling.

Figure 3. GFP-Atg8 was not harvested or processed by Δatg8 cells during leucine starvation. (A) The photos show representative cells that were pre-grown in SD and then stained for 30 min with FM4–64. Stained cells were then washed and starved for 12 h (SD-L) or 24 h (SD-N) and examined. (B) Proteins were extracted from cultures harvested at the same times as in (A), separated by PAGE, transferred to duplicate membranes, and treated with antibodies to visualize GFP or actin. The amounts of GFP-Atg8 and GFP relative to actin are shown in the lower table.
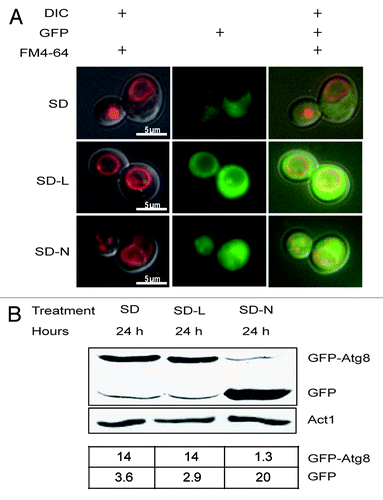
Figure 3. GFP-Atg8 was not harvested or processed by Δatg8 cells during leucine starvation. (A) The photos show representative cells that were pre-grown in SD and then stained for 30 min with FM4–64. Stained cells were then washed and starved for 12 h (SD-L) or 24 h (SD-N) and examined. (B) Proteins were extracted from cultures harvested at the same times as in (A), separated by PAGE, transferred to duplicate membranes, and treated with antibodies to visualize GFP or actin. The amounts of GFP-Atg8 and GFP relative to actin are shown in the lower table.

Figure 4. Leucine-starved cells harvested basal levels of Ape1. (A) Representative cells in cultures expressing Ape1-RFP after 12 h (SD-L) and 24 h (SD-N) starvation in the presence or absence of 0.22 µM rapamycin. (B) Average percentage of the population (± standard deviations) showing the indicated phenotypes. Each value was derived from looking at 100–200 cells in 3 independent experiments. (C) Proteins were extracted from PS cultures harvested at the times indicated above, separated by PAGE, transferred to duplicate membranes, and treated with antibodies to visualize Ape1 or actin. The amounts of Ape1 relative to actin are shown in the lower table.
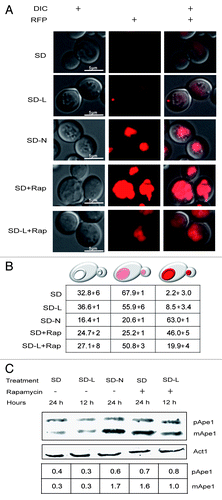
Figure 4. Leucine-starved cells harvested basal levels of Ape1. (A) Representative cells in cultures expressing Ape1-RFP after 12 h (SD-L) and 24 h (SD-N) starvation in the presence or absence of 0.22 µM rapamycin. (B) Average percentage of the population (± standard deviations) showing the indicated phenotypes. Each value was derived from looking at 100–200 cells in 3 independent experiments. (C) Proteins were extracted from PS cultures harvested at the times indicated above, separated by PAGE, transferred to duplicate membranes, and treated with antibodies to visualize Ape1 or actin. The amounts of Ape1 relative to actin are shown in the lower table.
Supplemental material

Additional material

Download Zip (1.6 MB)

Reprints and Corporate Permissions

Please note: Selecting permissions does not provide access to the full text of the article, please see our help page How do I view content?

To request a reprint or corporate permissions for this article, please click on the relevant link below:

Academic Permissions

Please note: Selecting permissions does not provide access to the full text of the article, please see our help page How do I view content?

Obtain permissions instantly via Rightslink by clicking on the button below:

If you are unable to obtain permissions via Rightslink, please complete and submit this Permissions form. For more information, please visit our Permissions help page.