3,571
Views
102
CrossRef citations to date
0
Altmetric
Basic Research Paper

Alpha-synuclein aggregation involves a bafilomycin A1-sensitive autophagy pathway

, , , , , , , , , & show all
Pages 754-766 | Received 03 Aug 2011, Accepted 14 Jan 2012, Published online: 01 May 2012

Figures & data

Figure 1. Immunohistochemistry for LC3 (A) and LAMP-2A (B) in α-synuclein positive Lewy bodies (LBs) in midbrain of DLB patients. Co-staining for both ALP markers was found in LBs. In addition, LAMP-2A was found in Lewy neurites (B, lower panel). Scale bars: 10 µm. Protein levels of LAMP-1, LAMP-2A and LC3 in cell lysates (lysosome enriched fraction, C and D; cytosolic fraction, E and F) of temporal cortex tissue of DLB cases and controls. Western blot analysis of ALP marker is shown for two representative DLB cases and controls (C and E). Quantitative densitometry revealed increased levels of LC3-II and LAMP-2A in the lysosome enriched fraction (D; DLB n = 12, controls n = 9), but not in the post-nuclear fraction (F; DLB n = 15, controls n = 11; D, upper panel). A LAMP-2A specific signal could only be detected in the lysosome enriched fraction. LAMP-1 was reduced in the lysosome-enriched fraction and increased in the post-nuclear fraction. (Student’s t-test, *p < 0.05).
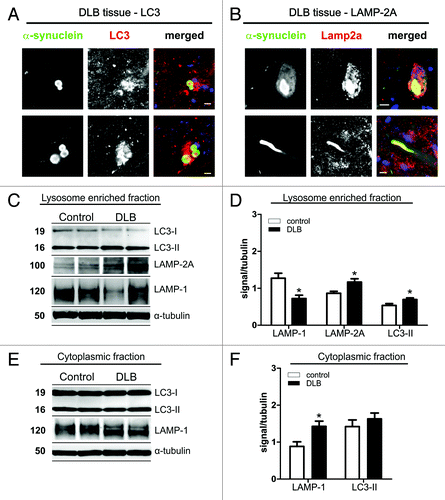
Figure 1. Immunohistochemistry for LC3 (A) and LAMP-2A (B) in α-synuclein positive Lewy bodies (LBs) in midbrain of DLB patients. Co-staining for both ALP markers was found in LBs. In addition, LAMP-2A was found in Lewy neurites (B, lower panel). Scale bars: 10 µm. Protein levels of LAMP-1, LAMP-2A and LC3 in cell lysates (lysosome enriched fraction, C and D; cytosolic fraction, E and F) of temporal cortex tissue of DLB cases and controls. Western blot analysis of ALP marker is shown for two representative DLB cases and controls (C and E). Quantitative densitometry revealed increased levels of LC3-II and LAMP-2A in the lysosome enriched fraction (D; DLB n = 12, controls n = 9), but not in the post-nuclear fraction (F; DLB n = 15, controls n = 11; D, upper panel). A LAMP-2A specific signal could only be detected in the lysosome enriched fraction. LAMP-1 was reduced in the lysosome-enriched fraction and increased in the post-nuclear fraction. (Student’s t-test, *p < 0.05).

Figure 2. SynT-aggregation model and WT-Syn control. (A) Transient co-transfection of H4 neuroglioma cells with an 93 aa long C-terminal tag fused to α-synuclein (SynT) co-expressed with synphilin-1 resulted in larger intracellular α-synuclein aggregation.Citation15,Citation24 Immunostaining for α-synuclein revealed several aggregates of 2–5 µm diameter that were resistant to RIPA (Ri) and urea (U) extractions and ThioS-positive. Smaller aggregates (< 2 µm) were ThioS negative. Transfection with untagged human WT α-synuclein (WT-Syn) did not result in larger α-synuclein immunopositive aggregates and was found only in the TBS-soluble fraction 24 h after transfection. Electron microscopy of untransfected (1st image) or SynT/Synphilin1 transfected H4 neuroglioma cells (2nd–4th image, B) revealed electrodense structures (2nd image and higher magnification in 3rd image) in transfected cells only, that were associated with vesicular structures which resemble autophagic vesicles. Aggregates were α-synuclein positive (immunogold-labeling for α-synuclein, 4th image). Scale bar: 1 µm.
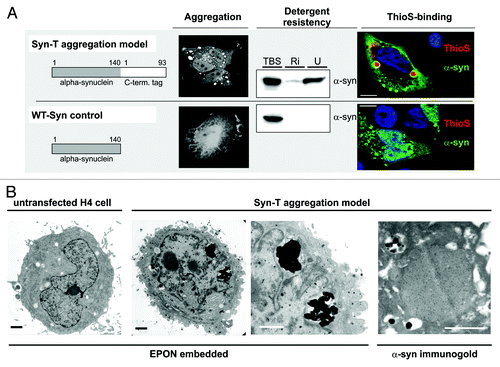
Figure 2. SynT-aggregation model and WT-Syn control. (A) Transient co-transfection of H4 neuroglioma cells with an 93 aa long C-terminal tag fused to α-synuclein (SynT) co-expressed with synphilin-1 resulted in larger intracellular α-synuclein aggregation.Citation15,Citation24 Immunostaining for α-synuclein revealed several aggregates of 2–5 µm diameter that were resistant to RIPA (Ri) and urea (U) extractions and ThioS-positive. Smaller aggregates (< 2 µm) were ThioS negative. Transfection with untagged human WT α-synuclein (WT-Syn) did not result in larger α-synuclein immunopositive aggregates and was found only in the TBS-soluble fraction 24 h after transfection. Electron microscopy of untransfected (1st image) or SynT/Synphilin1 transfected H4 neuroglioma cells (2nd–4th image, B) revealed electrodense structures (2nd image and higher magnification in 3rd image) in transfected cells only, that were associated with vesicular structures which resemble autophagic vesicles. Aggregates were α-synuclein positive (immunogold-labeling for α-synuclein, 4th image). Scale bar: 1 µm.

Figure 3. (A and B) ALP marker expression pattern in transfected H4 cells showed a co-staining of LAMP-1, LAMP-2A and, LC3 and α-synuclein positive aggregates in the SynT-aggregation model (A; indicated by arrows, representative α-synuclein aggregates are magnified), whereas no changes of ALP marker expression pattern were observed in WT-Syn control transfected cells compared with nontransfected neighboring cells (B). (C) In temporal cortex tissue of α-synuclein transgenic animals LAMP-2A co-labeled mainly the outer rim of α-synuclein positive inclusions (arrows), whereas co-labeling of LC3 and α-synuclein could be detected either at the rim (arrows), or homogenously distributed. LAMP-1 was not found in α-synuclein inclusions in vivo (data not shown). Scale bars: 10 µm.
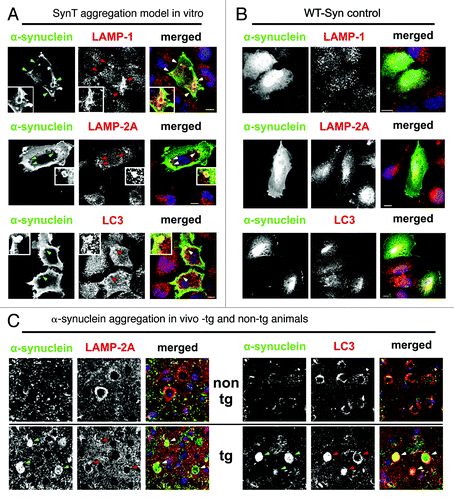
Figure 3. (A and B) ALP marker expression pattern in transfected H4 cells showed a co-staining of LAMP-1, LAMP-2A and, LC3 and α-synuclein positive aggregates in the SynT-aggregation model (A; indicated by arrows, representative α-synuclein aggregates are magnified), whereas no changes of ALP marker expression pattern were observed in WT-Syn control transfected cells compared with nontransfected neighboring cells (B). (C) In temporal cortex tissue of α-synuclein transgenic animals LAMP-2A co-labeled mainly the outer rim of α-synuclein positive inclusions (arrows), whereas co-labeling of LC3 and α-synuclein could be detected either at the rim (arrows), or homogenously distributed. LAMP-1 was not found in α-synuclein inclusions in vivo (data not shown). Scale bars: 10 µm.

Figure 4. Expression levels of LAMP-1/2A and LC3-II in α-synuclein transfected H4 cells and in α-synuclein transgenic mice. Representative western blots and intensity quantification of ALP marker normalized to actin are shown for in vivo (4 animals/group, A and C) and in vitro (5 independent experiments, B and D). Quantification of ALP marker expression in α-synuclein transgenic animals revealed significant increased LAMP-2A and LC3-II levels compared with non-transgenic littermates (C). LC3-II levels were also increased in the SynT-aggregation model (SynT) compared with WT-Syn control transfected H4 cells (WT-Syn, D). LAMP-2A levels were increased, but did not reach significance (p = 0.12 compared with WT-Syn, D). ALP marker expression in α-synuclein aggregation models were either compared with nontransgenic animals or to WT-Syn transfected cells (after normalization to empty vector transfected cells). Student’s t-test, *p < 0.05.
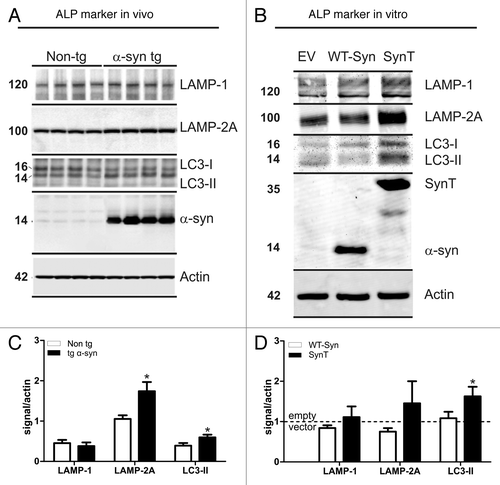
Figure 4. Expression levels of LAMP-1/2A and LC3-II in α-synuclein transfected H4 cells and in α-synuclein transgenic mice. Representative western blots and intensity quantification of ALP marker normalized to actin are shown for in vivo (4 animals/group, A and C) and in vitro (5 independent experiments, B and D). Quantification of ALP marker expression in α-synuclein transgenic animals revealed significant increased LAMP-2A and LC3-II levels compared with non-transgenic littermates (C). LC3-II levels were also increased in the SynT-aggregation model (SynT) compared with WT-Syn control transfected H4 cells (WT-Syn, D). LAMP-2A levels were increased, but did not reach significance (p = 0.12 compared with WT-Syn, D). ALP marker expression in α-synuclein aggregation models were either compared with nontransgenic animals or to WT-Syn transfected cells (after normalization to empty vector transfected cells). Student’s t-test, *p < 0.05.

Figure 5. Transient transfection with the SynT aggregation model leads to α-synuclein positive aggregate formation (green, A) in 40–50% of transfected cells (C), whereas transfection with WT-syn did not result in aggregation (green, B and C) and served as control. Note that transfected cells (either with SynT or WT-syn) were not caspase-3 positive (red, A and B). Nuclei were stained in blue (A and B). (D) Toxicity as measured by the release of adenylate kinase in transfected cells (fold of mock transfected cells) showed no difference between the SynT-aggregation model (n = 9) or WT-Syn control (n = 7). Inhibition of ALP using BafA1 reduced the number of cells with SynT-aggregates (E, *p < 0.001) paralleled by increased toxicity of SynT (F, *p < 0.05). Treating WT-Syn transfected cells with BafA1 did not result in aggregation and its toxicity was not affected by ALP modulation. ALP activation by rapamycin did not alter toxicity or aggregation in transfected cells. Scale bars: 10 µm.
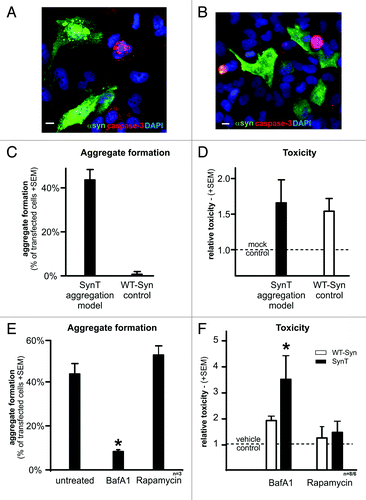
Figure 5. Transient transfection with the SynT aggregation model leads to α-synuclein positive aggregate formation (green, A) in 40–50% of transfected cells (C), whereas transfection with WT-syn did not result in aggregation (green, B and C) and served as control. Note that transfected cells (either with SynT or WT-syn) were not caspase-3 positive (red, A and B). Nuclei were stained in blue (A and B). (D) Toxicity as measured by the release of adenylate kinase in transfected cells (fold of mock transfected cells) showed no difference between the SynT-aggregation model (n = 9) or WT-Syn control (n = 7). Inhibition of ALP using BafA1 reduced the number of cells with SynT-aggregates (E, *p < 0.001) paralleled by increased toxicity of SynT (F, *p < 0.05). Treating WT-Syn transfected cells with BafA1 did not result in aggregation and its toxicity was not affected by ALP modulation. ALP activation by rapamycin did not alter toxicity or aggregation in transfected cells. Scale bars: 10 µm.

Figure 6. Neuropathological alterations in the temporal cortex of α-synuclein transgenic mice. Immunocytochemical analysis with an antibody against α-synuclein (red, top panel) showed that transgenic mice (B) displayed α-synuclein positive inclusions and punctated expression patterns compared with nontransgenic control (A). Alpha-synuclein positive inclusions were reduced by BafA1 treatment (C) compared with saline treated animals. The dendritic marker MAP2 and the synaptic marker SY38 were reduced in α-synuclein transgenic mice (F and J) compared with non-transgenic mice (E and I). ALP inhibition with BafA1 aggravated MAP2 and SY38 immunoreactivity levels (G and K). Quantitative analysis of inclusion- and punctated α-synuclein (D), MAP2 (H) and SY38 (L) immunoreactivity are displayed in the right panel. Significant changes are indicated (*) as compared with saline-treated animals (for α-synuclein immunoreactivity) or compared with saline-treated non-tg animals (for MAP2 and SY38 immunoreactivity). Scale bars: 10 µm.
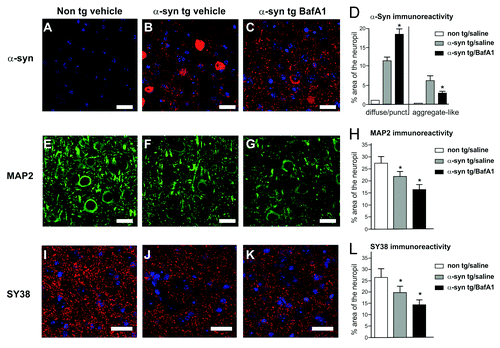
Figure 6. Neuropathological alterations in the temporal cortex of α-synuclein transgenic mice. Immunocytochemical analysis with an antibody against α-synuclein (red, top panel) showed that transgenic mice (B) displayed α-synuclein positive inclusions and punctated expression patterns compared with nontransgenic control (A). Alpha-synuclein positive inclusions were reduced by BafA1 treatment (C) compared with saline treated animals. The dendritic marker MAP2 and the synaptic marker SY38 were reduced in α-synuclein transgenic mice (F and J) compared with non-transgenic mice (E and I). ALP inhibition with BafA1 aggravated MAP2 and SY38 immunoreactivity levels (G and K). Quantitative analysis of inclusion- and punctated α-synuclein (D), MAP2 (H) and SY38 (L) immunoreactivity are displayed in the right panel. Significant changes are indicated (*) as compared with saline-treated animals (for α-synuclein immunoreactivity) or compared with saline-treated non-tg animals (for MAP2 and SY38 immunoreactivity). Scale bars: 10 µm.

Figure 7. Detergent soluble and insoluble α-synuclein levels in BafA1 and rapamycin- treated transgenic and nontransgenic mice (A). The amount of detergent insoluble α-synuclein fraction was increased by BafA1 (B), to the expense of soluble α-synuclein levels (C). Significant changes are indicated as BafA1 treatment. (*) compared with vehicle treatment p < 0.05, Student’s t-test.
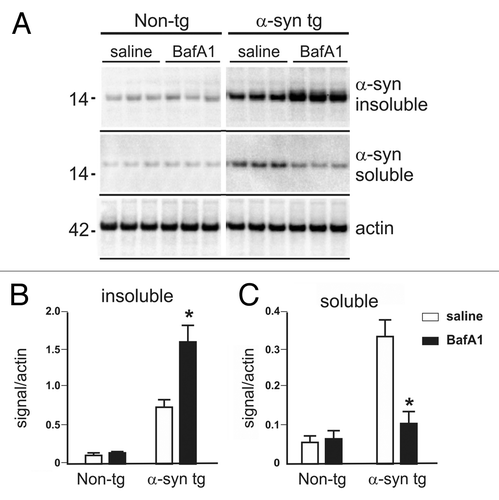
Figure 7. Detergent soluble and insoluble α-synuclein levels in BafA1 and rapamycin- treated transgenic and nontransgenic mice (A). The amount of detergent insoluble α-synuclein fraction was increased by BafA1 (B), to the expense of soluble α-synuclein levels (C). Significant changes are indicated as BafA1 treatment. (*) compared with vehicle treatment p < 0.05, Student’s t-test.

Figure 8. Aggregation and toxicity of transfected H4 cells after treatment with different ALP modulating compounds. The effect of BafA1 on SynT-aggregation (A,B) could not be resembled by 3-MA that did not reduce SynT-aggregation (B). Interestingly, blocking V-ATPase function using chloroquine (CQ) could substantially reduce aggregation, similar to BafA1 treatment (B), however did not increase toxicity of SynT (C). Here, increase of SynT toxicity over WT-syn by blocking ALP was only present in BafA1 treated cells. Treatment with 3-MA even reduced toxicity of SynT compared with BafA1. Toxicity was measured by quantifying activated caspase-3 immunoreactivity in the SynT-aggregation model compared with nonaggregating WT-Syn transfected H4 cells. Significant changes are indicated as treatment (*) compared with control treatment or treatment compared with BafA1. #p < 0.05, Student’s t-test. Scale bars: 10 µm.
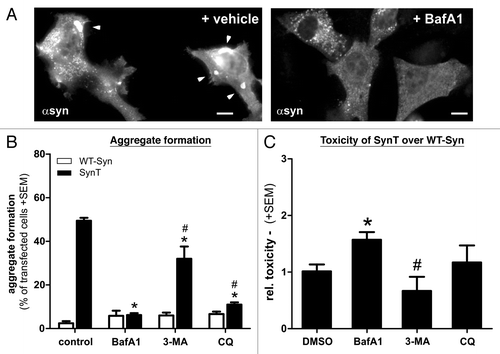
Figure 8. Aggregation and toxicity of transfected H4 cells after treatment with different ALP modulating compounds. The effect of BafA1 on SynT-aggregation (A,B) could not be resembled by 3-MA that did not reduce SynT-aggregation (B). Interestingly, blocking V-ATPase function using chloroquine (CQ) could substantially reduce aggregation, similar to BafA1 treatment (B), however did not increase toxicity of SynT (C). Here, increase of SynT toxicity over WT-syn by blocking ALP was only present in BafA1 treated cells. Treatment with 3-MA even reduced toxicity of SynT compared with BafA1. Toxicity was measured by quantifying activated caspase-3 immunoreactivity in the SynT-aggregation model compared with nonaggregating WT-Syn transfected H4 cells. Significant changes are indicated as treatment (*) compared with control treatment or treatment compared with BafA1. #p < 0.05, Student’s t-test. Scale bars: 10 µm.
Supplemental material

Additional material

Download Zip (249.3 KB)

Reprints and Corporate Permissions

Please note: Selecting permissions does not provide access to the full text of the article, please see our help page How do I view content?

To request a reprint or corporate permissions for this article, please click on the relevant link below:

Academic Permissions

Please note: Selecting permissions does not provide access to the full text of the article, please see our help page How do I view content?

Obtain permissions instantly via Rightslink by clicking on the button below:

If you are unable to obtain permissions via Rightslink, please complete and submit this Permissions form. For more information, please visit our Permissions help page.