3,389
Views
51
CrossRef citations to date
0
Altmetric
Basic Research Paper

The deubiquitinating enzyme USP36 controls selective autophagy activation by ubiquitinated proteins

, , , , , & show all
Pages 767-779 | Received 16 Jun 2011, Accepted 16 Jan 2012, Published online: 01 May 2012

Figures & data

Figure 1.dUsp36 null mutation impairs organismal growth and activates autophagy. (A) Wild-type (left), dUsp36 null mutant (middle, dUsp36Δ43/dUsp36Δ43) and rescued (right, UAS-dUsp36/+; daGal, dUsp36Δ43/dUsp36Δ43) larvae. (B) Larval length measurements at different time points. Continuous line: wild-type larvae, dotted line: dUsp36 null mutant larvae. Fluorescent microscope imaging of unfixed fat bodies from wild-type (C) or dUsp36 null mutant larvae stained with Lysotracker Red (red) and Hoechst 33342 (blue). Scale bar: 10 µm.
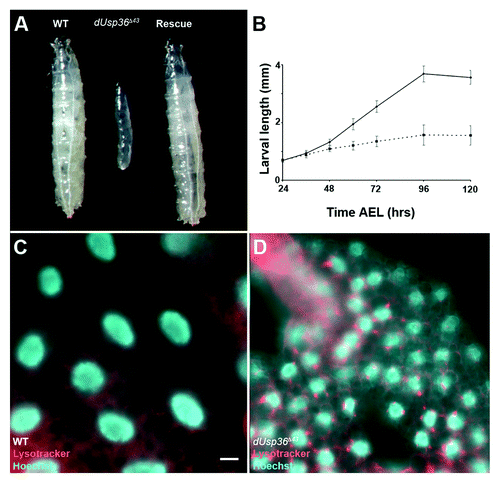
Figure 1.dUsp36 null mutation impairs organismal growth and activates autophagy. (A) Wild-type (left), dUsp36 null mutant (middle, dUsp36Δ43/dUsp36Δ43) and rescued (right, UAS-dUsp36/+; daGal, dUsp36Δ43/dUsp36Δ43) larvae. (B) Larval length measurements at different time points. Continuous line: wild-type larvae, dotted line: dUsp36 null mutant larvae. Fluorescent microscope imaging of unfixed fat bodies from wild-type (C) or dUsp36 null mutant larvae stained with Lysotracker Red (red) and Hoechst 33342 (blue). Scale bar: 10 µm.

Figure 2. Clonal analysis of dUsp36 function in the fat body. dUsp36 null mutant cells expressing nuclear GFP were generated by MARCM and stained with Alexa 546-phalloidin (red) and DAPI (blue) (A) or Lysotracker Red (red) (B). MARCM was also used to express the GFP-LC3 autophagy reporter in dUsp36 null mutant (C) and rescued cells (D). (E) Quantification of autophagy in wild-type, dUsp36 mutant or rescued cells. Autophagy was considered to be activated in a particular cell if at least one GFP-LC3 vesicle was observed. Bracketed numbers represent the number of individual cells examined. (F) Quantification of the relative cell size of dUsp36 mutant, rescued cells, and of dUsp36 mutant cells expressing various members of the TOR pathway. Area measurements of mutant cells relative to surrounding wild-type cells are shown. (**p < 0.001, independence chi-square test). Genotypes: (A and B) y,w,hsFLP/+; Cg-Gal4, UAS-GFPnls/+; FRT80 dUsp36Δ43/FRT80 TubGal80 (C) y,w,hsFLP/+; Cg-Gal4, UAS-GFP-LC3/+; FRT80 dUsp36Δ43/FRT80 TubGal80 (D) y,w,hsFLP/UAS-dUSP36; Cg-Gal4, UAS-GFP-LC3/+; FRT80 dUsp36Δ43/FRT80 TubGal80. Scale bar: 10 µm.
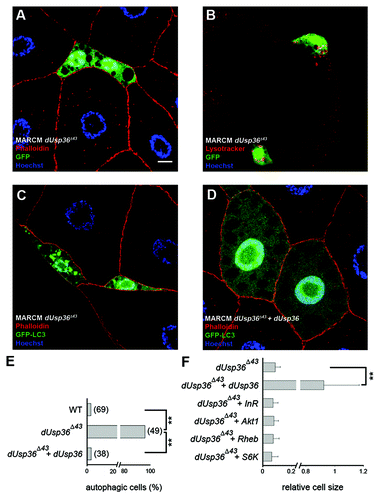
Figure 2. Clonal analysis of dUsp36 function in the fat body. dUsp36 null mutant cells expressing nuclear GFP were generated by MARCM and stained with Alexa 546-phalloidin (red) and DAPI (blue) (A) or Lysotracker Red (red) (B). MARCM was also used to express the GFP-LC3 autophagy reporter in dUsp36 null mutant (C) and rescued cells (D). (E) Quantification of autophagy in wild-type, dUsp36 mutant or rescued cells. Autophagy was considered to be activated in a particular cell if at least one GFP-LC3 vesicle was observed. Bracketed numbers represent the number of individual cells examined. (F) Quantification of the relative cell size of dUsp36 mutant, rescued cells, and of dUsp36 mutant cells expressing various members of the TOR pathway. Area measurements of mutant cells relative to surrounding wild-type cells are shown. (**p < 0.001, independence chi-square test). Genotypes: (A and B) y,w,hsFLP/+; Cg-Gal4, UAS-GFPnls/+; FRT80 dUsp36Δ43/FRT80 TubGal80 (C) y,w,hsFLP/+; Cg-Gal4, UAS-GFP-LC3/+; FRT80 dUsp36Δ43/FRT80 TubGal80 (D) y,w,hsFLP/UAS-dUSP36; Cg-Gal4, UAS-GFP-LC3/+; FRT80 dUsp36Δ43/FRT80 TubGal80. Scale bar: 10 µm.

Figure 3. Autophagy activation in dUsp36 silenced cells depends on Atg5 and ref(2)P. (A–C) Mid third instar larvae. Expression of the GFP-LC3 autophagy reporter was clonally activated in fat body cells alone (A) or in combination with a dsRNA trangene targeting dUsp36 (B) using the FLPout method. (C) Quantification of autophagy in cells expressing GFP-LC3 alone (WT) or in combination with the dsRNA trangene targeting dUsp36 (dUsp36-IR). (D–H) Late third instar larvae. The FLPout method was used to express the GFP-LC3 reporter and the dUsp36-IR transgene alone (D) or in combination with the Atg5-IR (E) or ref(2)P-IR (F) transgenes. (G) Quantification of autophagy in wild-type cells, in cells expressing the dUsp36-IR transgene alone, or in combination with the imd-IR, Atg5-IR or ref(2)P-IR transgenes. (H) Quantification of the relative cell size of cells expressing the dATA3A-IR transgene or the dUsp36-IR transgene alone or in combination with the imd-IR, Atg5-IR or ref(2)P-IR transgenes. (A, B and D–F) Confocal sections of fixed fat bodies stained with GFP (green), Alexa 546-phalloidin (red) and DAPI (blue) are shown. G, H: Bracketed numbers represent the number of individual cells examined. (** = p < 0.001, independence chi-square test). Genotypes: (A) y,w,hsFLP/+; UAS-GFP-LC3/+, Ac > CD2 > Gal4/+ (B) y,w,hsFLP/+; UAS-GFP-LC3/UAS-dUsp36-IR, Ac > CD2 > Gal4/+ (D) y,w,hsFLP/+; UAS-GFP-LC3,UAS-dUsp36-IR/+, Ac > CD2 > Gal4/+ (E) y,w,hsFLP/UAS-Atg5-IR; UAS-GFP-LC3,UAS-dUsp36-IR/+, Ac > CD2 > Gal4/+ (F) y,w,hsFLP/+; UAS-GFP-LC3,UAS-dUsp36-IR/UAS-ref(2)P-IR, Ac > CD2 > Gal4/+. Scale bar: 10 µm.
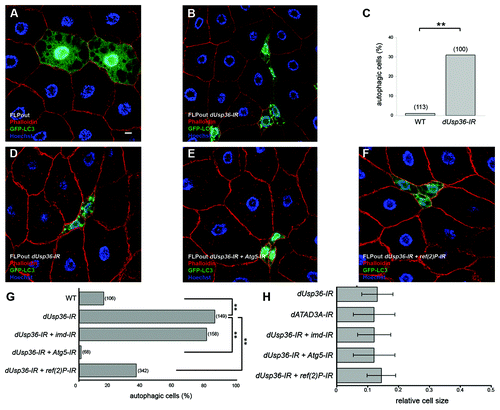
Figure 3. Autophagy activation in dUsp36 silenced cells depends on Atg5 and ref(2)P. (A–C) Mid third instar larvae. Expression of the GFP-LC3 autophagy reporter was clonally activated in fat body cells alone (A) or in combination with a dsRNA trangene targeting dUsp36 (B) using the FLPout method. (C) Quantification of autophagy in cells expressing GFP-LC3 alone (WT) or in combination with the dsRNA trangene targeting dUsp36 (dUsp36-IR). (D–H) Late third instar larvae. The FLPout method was used to express the GFP-LC3 reporter and the dUsp36-IR transgene alone (D) or in combination with the Atg5-IR (E) or ref(2)P-IR (F) transgenes. (G) Quantification of autophagy in wild-type cells, in cells expressing the dUsp36-IR transgene alone, or in combination with the imd-IR, Atg5-IR or ref(2)P-IR transgenes. (H) Quantification of the relative cell size of cells expressing the dATA3A-IR transgene or the dUsp36-IR transgene alone or in combination with the imd-IR, Atg5-IR or ref(2)P-IR transgenes. (A, B and D–F) Confocal sections of fixed fat bodies stained with GFP (green), Alexa 546-phalloidin (red) and DAPI (blue) are shown. G, H: Bracketed numbers represent the number of individual cells examined. (** = p < 0.001, independence chi-square test). Genotypes: (A) y,w,hsFLP/+; UAS-GFP-LC3/+, Ac > CD2 > Gal4/+ (B) y,w,hsFLP/+; UAS-GFP-LC3/UAS-dUsp36-IR, Ac > CD2 > Gal4/+ (D) y,w,hsFLP/+; UAS-GFP-LC3,UAS-dUsp36-IR/+, Ac > CD2 > Gal4/+ (E) y,w,hsFLP/UAS-Atg5-IR; UAS-GFP-LC3,UAS-dUsp36-IR/+, Ac > CD2 > Gal4/+ (F) y,w,hsFLP/+; UAS-GFP-LC3,UAS-dUsp36-IR/UAS-ref(2)P-IR, Ac > CD2 > Gal4/+. Scale bar: 10 µm.

Figure 4. Genetic interaction between dUsp36 and ref(2)P. (A) Survival rate of dUsp36 null mutant larvae or of ref(2)P; dUsp36 double mutant larvae at 4 d AEL (**p < 0.001, independence chi-square test, n = 50 for each genotype). Fluorescent microscope imaging of unfixed fat bodies from dUsp36 null mutant larvae (B) or ref(2)Pod2; dUsp36 double mutant larvae (C) stained with Lysotracker Red (red) and Hoechst 33342 (blue). Confocal sections of fixed fat body cells stained with Lysotracker Red (red), GFP (green), and DAPI (blue) from dUsp36 null mutant clone generated either in a wild-type (D) or in a ref(2)Pod2 mutant background (E). Genotypes: (B) dUsp36Δ43/dUsp36Δ43 (C) ref(2)Pod2/ref(2)Pod2; dUsp36Δ43/dUsp36Δ43 (D) y,w,hsFLP/+; FRT79 dUsp36Δ43/FRT79UbiGFP (E) y,w,hsFLP/+; ref(2)Pod2/ref(2)Pod2; FRT79 dUsp36Δ43/FRT79UbiGFP. Scale bar: 10 µm.
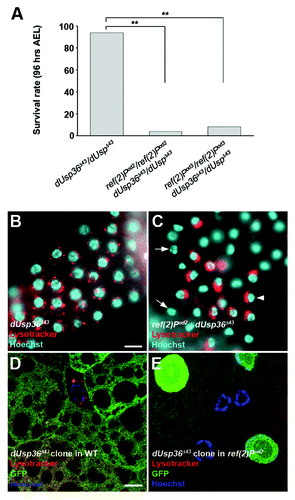
Figure 4. Genetic interaction between dUsp36 and ref(2)P. (A) Survival rate of dUsp36 null mutant larvae or of ref(2)P; dUsp36 double mutant larvae at 4 d AEL (**p < 0.001, independence chi-square test, n = 50 for each genotype). Fluorescent microscope imaging of unfixed fat bodies from dUsp36 null mutant larvae (B) or ref(2)Pod2; dUsp36 double mutant larvae (C) stained with Lysotracker Red (red) and Hoechst 33342 (blue). Confocal sections of fixed fat body cells stained with Lysotracker Red (red), GFP (green), and DAPI (blue) from dUsp36 null mutant clone generated either in a wild-type (D) or in a ref(2)Pod2 mutant background (E). Genotypes: (B) dUsp36Δ43/dUsp36Δ43 (C) ref(2)Pod2/ref(2)Pod2; dUsp36Δ43/dUsp36Δ43 (D) y,w,hsFLP/+; FRT79 dUsp36Δ43/FRT79UbiGFP (E) y,w,hsFLP/+; ref(2)Pod2/ref(2)Pod2; FRT79 dUsp36Δ43/FRT79UbiGFP. Scale bar: 10 µm.

Figure 5. Ubiquitinated proteins accumulate in dUsp36 mutant cells and are eliminated by autophagy. Confocal sections of fat body cells stained with nuclear GFP (green), the FK2 monoclonal antibody detecting ubiquitinated proteins (red), and DAPI (blue). dUsp36 null mutant cells generated by MARCM (A, A’) and dUsp36 RNAi silenced cells generated by FLPout (C, C’) accumulate nuclear ubiquitinated protein aggregates. These aggregates are not observed in rescued cells (B, B’). Cytoplasmic ubiquitinated protein aggregates are observed upon autophagy inhibition in Atg5; dUsp36 double knockout cells. Genotypes: (A, A’) y,w,hsFLP/+; Cg-Gal4, UAS-GFPnls/+; FRT80 dUsp36Δ43/FRT80 TubGal80 (B, B’) y,w,hsFLP/UAS-dUsp36; Cg-Gal4, UAS-GFPnls/+; FRT80 dUsp36Δ43/FRT80 TubGal80 (C, C’) y,w,hsFLP/+; UAS-GFPnls,UAS-dUsp36-IR/+, Ac > CD2 > Gal4/+ (D, D’) y,w,hsFLP/UAS-Atg5-IR; UAS-GFPnls,UAS-dUsp36-IR/+, Ac > CD2 > Gal4/+. Scale bar: 10 µm.
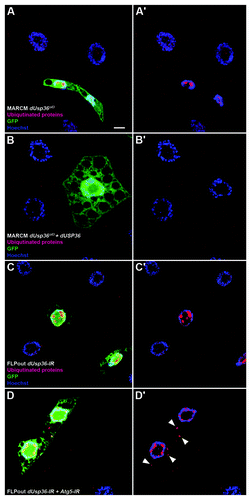
Figure 5. Ubiquitinated proteins accumulate in dUsp36 mutant cells and are eliminated by autophagy. Confocal sections of fat body cells stained with nuclear GFP (green), the FK2 monoclonal antibody detecting ubiquitinated proteins (red), and DAPI (blue). dUsp36 null mutant cells generated by MARCM (A, A’) and dUsp36 RNAi silenced cells generated by FLPout (C, C’) accumulate nuclear ubiquitinated protein aggregates. These aggregates are not observed in rescued cells (B, B’). Cytoplasmic ubiquitinated protein aggregates are observed upon autophagy inhibition in Atg5; dUsp36 double knockout cells. Genotypes: (A, A’) y,w,hsFLP/+; Cg-Gal4, UAS-GFPnls/+; FRT80 dUsp36Δ43/FRT80 TubGal80 (B, B’) y,w,hsFLP/UAS-dUsp36; Cg-Gal4, UAS-GFPnls/+; FRT80 dUsp36Δ43/FRT80 TubGal80 (C, C’) y,w,hsFLP/+; UAS-GFPnls,UAS-dUsp36-IR/+, Ac > CD2 > Gal4/+ (D, D’) y,w,hsFLP/UAS-Atg5-IR; UAS-GFPnls,UAS-dUsp36-IR/+, Ac > CD2 > Gal4/+. Scale bar: 10 µm.

Figure 6. The Ref(2)P/p62 protein accumulates in dUsp36 silenced cells. Confocal sections of fat body cells after FLPout induced expression of the Ref(2)P-GFP fusion protein in wild-type (A) or dUsp36 knock-down cells (B). The size and intensity of Ref(2)P-GFP dots are enhanced by dUsp36 inactivation. Expression of the endogenous Ref(2)P protein in fat body cells expressing the dUsp36-IR transgene alone (C) or in combination with Atg5-IR (D) shows that, as ubiquitinated proteins, the endogenous Ref(2)P protein accumulates in Atg5; dUsp36 double knockout cells. Genotypes: (A) y,w,hsFLP/+; UAS-Ref(2)P-GFP/+, Ac > CD2 > Gal4/+ (B) y,w,hsFLP/+; UAS-Ref(2)P-GFP,UAS-dUsp36-IR/+, Ac > CD2 > Gal4/+ (C) y,w,hsFLP/+; UAS-GFPnls,UAS-dUsp36-IR/+, Ac > CD2 > Gal4/+ (D) y,w,hsFLP/UAS-Atg5-IR; UAS-GFPnls,UAS-dUsp36-IR/+, Ac > CD2 > Gal4/+. Scale bar: 10 µm.
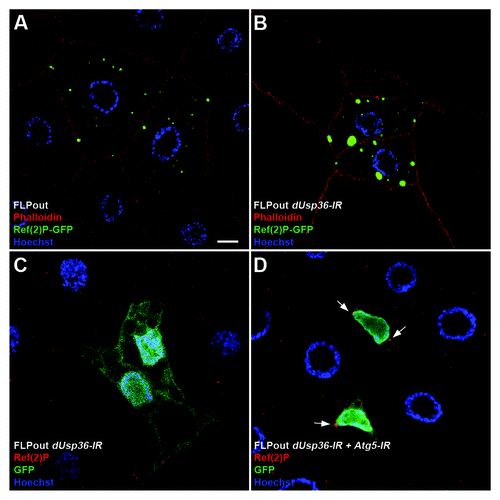
Figure 6. The Ref(2)P/p62 protein accumulates in dUsp36 silenced cells. Confocal sections of fat body cells after FLPout induced expression of the Ref(2)P-GFP fusion protein in wild-type (A) or dUsp36 knock-down cells (B). The size and intensity of Ref(2)P-GFP dots are enhanced by dUsp36 inactivation. Expression of the endogenous Ref(2)P protein in fat body cells expressing the dUsp36-IR transgene alone (C) or in combination with Atg5-IR (D) shows that, as ubiquitinated proteins, the endogenous Ref(2)P protein accumulates in Atg5; dUsp36 double knockout cells. Genotypes: (A) y,w,hsFLP/+; UAS-Ref(2)P-GFP/+, Ac > CD2 > Gal4/+ (B) y,w,hsFLP/+; UAS-Ref(2)P-GFP,UAS-dUsp36-IR/+, Ac > CD2 > Gal4/+ (C) y,w,hsFLP/+; UAS-GFPnls,UAS-dUsp36-IR/+, Ac > CD2 > Gal4/+ (D) y,w,hsFLP/UAS-Atg5-IR; UAS-GFPnls,UAS-dUsp36-IR/+, Ac > CD2 > Gal4/+. Scale bar: 10 µm.

Figure 7. The reduced expression of USP36 induces p62-dependent autophagy in human cells. Confocal section of GFP-LC3-HeLa cells transfected with control siRNA (A), or siRNA targeting either ATG5 (B) or USP36 (C). Western blot analysis of LC3 (D) and p62 (E) expressions in total cell lysates. (F–H) Quantification of GFP+ vesicles per cell profile. Comparison of siControl, siATG5 and siUSP36-transfected cells (F), of siControl and siUSP36-transfected cells treated with bafilomycin A1 (BAF, G) and of siControl, siUSP36, sip62 and siUSP36+sip62-transfected cells (H). Results are expressed as the relative fold induction of dots number in siATG5 or siUSP36, sip62 or siUSP36+sip62-treated cells compared with control cells for 3 individual experiments (**p < 0.01, *p < 0.05, Student’s test).
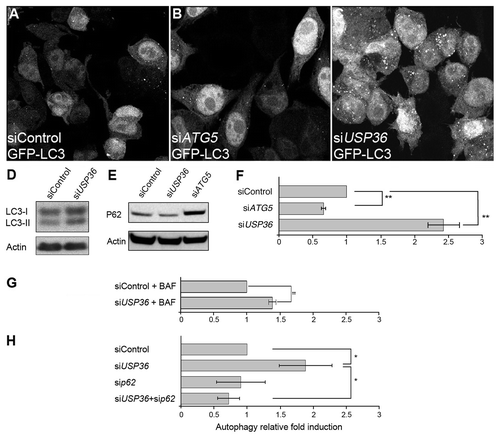
Figure 7. The reduced expression of USP36 induces p62-dependent autophagy in human cells. Confocal section of GFP-LC3-HeLa cells transfected with control siRNA (A), or siRNA targeting either ATG5 (B) or USP36 (C). Western blot analysis of LC3 (D) and p62 (E) expressions in total cell lysates. (F–H) Quantification of GFP+ vesicles per cell profile. Comparison of siControl, siATG5 and siUSP36-transfected cells (F), of siControl and siUSP36-transfected cells treated with bafilomycin A1 (BAF, G) and of siControl, siUSP36, sip62 and siUSP36+sip62-transfected cells (H). Results are expressed as the relative fold induction of dots number in siATG5 or siUSP36, sip62 or siUSP36+sip62-treated cells compared with control cells for 3 individual experiments (**p < 0.01, *p < 0.05, Student’s test).
Supplemental material

Additional material

Download Zip (760.5 KB)

Reprints and Corporate Permissions

Please note: Selecting permissions does not provide access to the full text of the article, please see our help page How do I view content?

To request a reprint or corporate permissions for this article, please click on the relevant link below:

Academic Permissions

Please note: Selecting permissions does not provide access to the full text of the article, please see our help page How do I view content?

Obtain permissions instantly via Rightslink by clicking on the button below:

If you are unable to obtain permissions via Rightslink, please complete and submit this Permissions form. For more information, please visit our Permissions help page.