Figures & data
Figure 1. Plasma membrane GJs internalize to form cytoplasmic double-membrane GJ vesicles [termed annular gap junctions (AGJs) or connexosomes] that subsequently are degraded. (A) HeLa cells transfected with Cx43-GFP efficiently express and assemble GJs in the adjacent plasma membranes of transfected cells after overnight expression (visible as green fluorescent lines and puncta, such as the one shown in insert 1). Over time, GJs bulge inward (insert 2), detach from the plasma membrane and form cytoplasmic AGJ vesicles or connexosomes (insert 3). (B) Selected still-images of a time-lapse recording of stably transfected Cx43-YFP expressing HeLa cells covering over 19 h (2 min image intervals), showing the formation of a GJ plaque, its endocytic internalization into the cytoplasm of one of the previously coupled cells, and final degradation of the generated AGJ vesicle, indicated by the loss of its fluorescence (marked with arrows). Combined phase contrast and fluorescence images are shown in (A and B) and in Movie 1. (C) Schematic representation depicting the progressive stages of GJ internalization. For ultrastructural and additional analyses of internalizing GJs see reference Citation8. (D) western blot analyses of total Cx43-GFP, or Cx43-YFP protein in transiently and stably expressing HeLa cells 72 h after BECN1 protein was depleted by RNAi-oligonucleotide transfection. SI-control cells were transfected with a scrambled non-targeting RISC-activating control oligonucleotide. Cx43-GFP/YFP was detected by probing with polyclonal anti-Cx43 antibodies. After stripping, blots were re-probed with anti-α-tubulin antibodies as a loading control. Normalized quantitative analyses revealed a two to 3-fold increase of Cx43-GFP/YFP in the BECN1-KD over SI-control cells.
![Figure 1. Plasma membrane GJs internalize to form cytoplasmic double-membrane GJ vesicles [termed annular gap junctions (AGJs) or connexosomes] that subsequently are degraded. (A) HeLa cells transfected with Cx43-GFP efficiently express and assemble GJs in the adjacent plasma membranes of transfected cells after overnight expression (visible as green fluorescent lines and puncta, such as the one shown in insert 1). Over time, GJs bulge inward (insert 2), detach from the plasma membrane and form cytoplasmic AGJ vesicles or connexosomes (insert 3). (B) Selected still-images of a time-lapse recording of stably transfected Cx43-YFP expressing HeLa cells covering over 19 h (2 min image intervals), showing the formation of a GJ plaque, its endocytic internalization into the cytoplasm of one of the previously coupled cells, and final degradation of the generated AGJ vesicle, indicated by the loss of its fluorescence (marked with arrows). Combined phase contrast and fluorescence images are shown in (A and B) and in Movie 1. (C) Schematic representation depicting the progressive stages of GJ internalization. For ultrastructural and additional analyses of internalizing GJs see reference Citation8. (D) western blot analyses of total Cx43-GFP, or Cx43-YFP protein in transiently and stably expressing HeLa cells 72 h after BECN1 protein was depleted by RNAi-oligonucleotide transfection. SI-control cells were transfected with a scrambled non-targeting RISC-activating control oligonucleotide. Cx43-GFP/YFP was detected by probing with polyclonal anti-Cx43 antibodies. After stripping, blots were re-probed with anti-α-tubulin antibodies as a loading control. Normalized quantitative analyses revealed a two to 3-fold increase of Cx43-GFP/YFP in the BECN1-KD over SI-control cells.](/cms/asset/d557a1b5-28a2-4ad9-8abf-40ebe16bf4b9/kaup_a_10919390_f0001.gif)
Figure 2. AGJ vesicles robustly colocalize with lysosomal and autophagosomal markers but only insignificantly with endosomal markers. (A) Schematic representation of phago-/lysosomal and endo-/lysosomal cellular degradation pathways and respective marker proteins (highlighted with blue shading) that have been investigated in this study. (B) Cx43-GFP or Cx43-mApple expressing HeLa cells were either labeled with antibodies specific for endosomal and lysosomal marker proteins (a–d), cotransfected with LAMP-1-cerulean (e), or stained with the acidophilic fluorescent probe, LysoTracker Red (f). Representative merged confocal fluorescence images obtained 20–24 h after transfection are shown. Individual and merged fluorescence signals of the boxed areas are shown at higher magnification on the right. Robust colocalization of vesicular Cx43 was observed with lysosomal markers (LAMP-1, LAMP-1-cerulean, and LysoTracker, panels d-f, as indicated by yellow, the resulting color of overlaying red and green emission signals), but only insignificantly with endosomal markers (EEA1 and Rab7, panels b and c). A notable colocalization of Cx43-GFP was also observed with the GTP-binding protein Rab5 (panel a), described to be involved in early steps of endocytosis (uncoating of clathrin-coated vesicles), and in targeting cytoplasmic cargo to autophagic degradation (see text). Representative colocalizing vesicles are marked with arrows; GJs are marked with arrowheads.
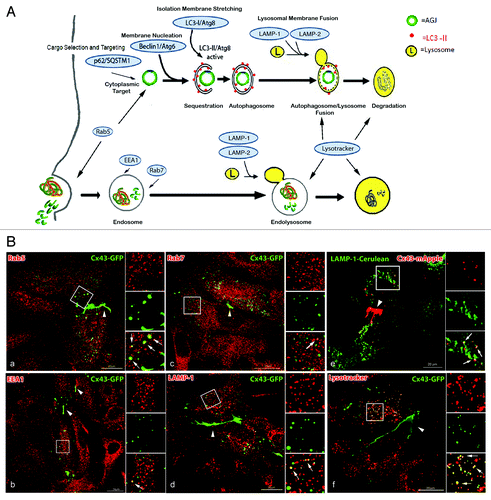
Figure 5. Efficient RNAi-mediated depletion of autophagy-relevant proteins monitored by western blot and quantitative fluorescence intensity measurements. HeLa cells were transfected with SI-control RNA-oligonucleotides, or with RNA-oligos targeting the autophagy-relevant proteins, LC3/(Atg8), BECN1/(Atg6), LAMP-2 and p62/SQSTM1 (KD). 48 h later cells were transfected with Cx43-GFP cDNA and analyzed for KD efficiency 72 h after oligo-transfection. (A) Target protein-depletion assayed by western blot analyses in SI-control and RNAi-KD cells. (B) Representative merged confocal fluorescence images of SI-control and KD cells acquired at identical exposure settings are shown. Individual and merged fluorescence signals of the boxed areas are shown at higher magnification on the right. Robust colocalization of Cx43-GFP containing cytoplasmic vesicles was observed with LC3/(Atg8), LAMP-2, and p62/SQSTM1 in mock treated, but not in KD cells (marked with arrows). GJ plaques are marked with arrowheads. Bars = 10 μm. (C) Fluorescence intensities (in arbitrary units) of Cx43-GFP (green) and RNAi-depleted protein (red) for both, SI-control and RNAi-treated cells, measured along lines depicted in (B). Efficient KD of all targeted proteins (> 90%) was confirmed by western blot and quantitative fluorescence line-scan analyses. BECN1/(Atg6) is known not to efficiently localize to autophagosomes and was not detected to colocalize with AGJ vesicles (B, panel 2). However, a significant cytoplasmic accumulation of AGJ vesicles and reduced AGJ/phagosome colocalization was observed in BECN1/(Atg6) depleted cells ().
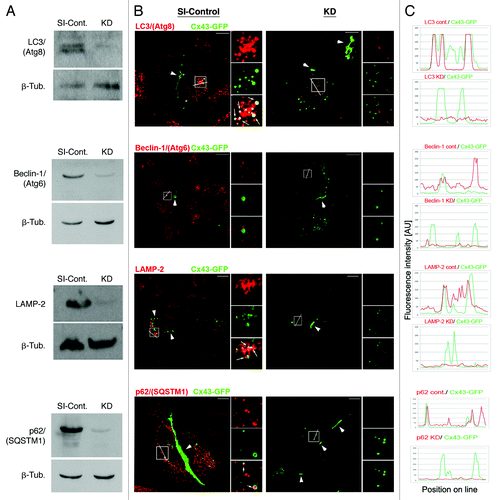
Figure 3. Fluorescence and ultrastructural evidence for autophagic AGJ vesicle degradation. (A) HeLa cells were cotransfected with Cx43-mApple and the mammalian autophagy marker protein GFP-LC3 (panel 1), or the activation-deficient LC3-mutant GFP-LC3(G120A) (panel 2). In cells, a fraction of cytoplasmic LC3 (LC3-I) is conjugated to phagophore-membranes (LC3-II) that localizes to autophagosomes; LC3(G120A) cannot be conjugated and remains cytoplasmic. Representative merged fluorescence images acquired 24 h post transfections are shown. Individual and merged fluorescence signals of the boxed areas are shown below at higher magnification. Robust colocalization of cytoplasmic AGJ vesicles present in Cx43-mApple expressing cells (red puncta) with GFP-LC3-II (green puncta) was observed in GFP-LC3 expressing cells, but not in GFP-LC3(G120A) expressing cells. Representative colocalizing AGJ vesicles are marked with arrows; GJs are marked with arrowheads. Bars = 10 μm. (B) Multiple stages characteristic of progressive autophagosome formation and maturation that formed around AGJ vesicles were revealed by ultrastructural analyses of Cx43-GFP expressing HeLa cell preparations. Double-membrane cisternae (phagophores, marked with arrows) progressively encircled AGJ vesicles (panels a–c), coalesced into phagophores (panels c–e) and fused with lysosomes (L, panels d and e), resulting in AGJ degradation inside the phagosome (panel f).
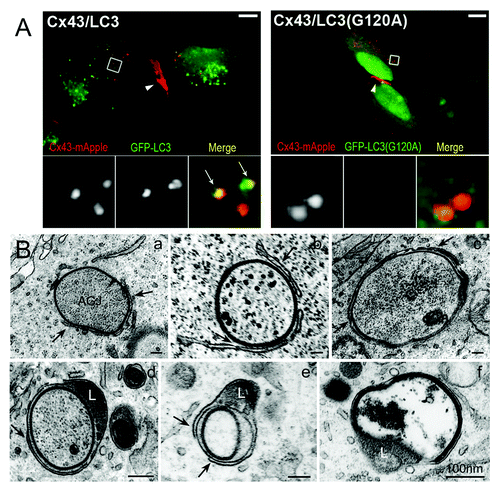
Figure 4. Pharmacological inhibition of autophagic degradation results in the accumulation of AGJ vesicles in the cytoplasm of drug-treated cells. (A) Schematic representation of autophagosome-maturation, and of representative steps blocked by drugs used in this study: (1) inhibition of cargo sequestration by 3MA and wortmannin; (2) inhibition of autophagosome/lysosome fusion by Bafilomycin A1. (B) Fluorescence images of drug-treated and control cells (mock) acquired approximately 21–23 h post transfection and 5 h into drug treatments are shown. Representative AGJ vesicles are marked with arrows. GJs are marked with arrowheads. Bars = 20 μm. (C) Quantitative analyses of total number of cytoplasmic AGJ vesicles (red columns) and GJ length (blue columns), and compared in percent to mock-treated cells are shown. In all drug treatments, a significant increase in the number of cytoplasmic AGJ vesicles was observed (99, 121 and 236%, marked with asterisks). GJ plaque length was not changed significantly in any of the experiments.
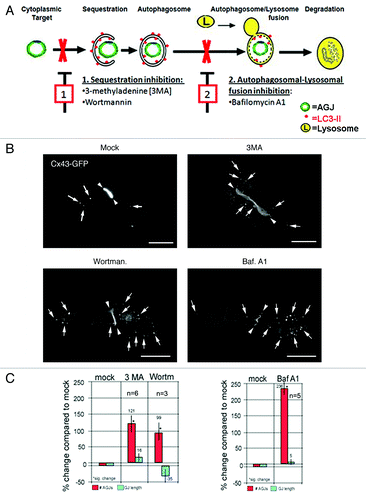
Figure 6. RNAi-mediated depletion of key-autophagic proteins inhibits degradation of AGJ vesicles and decreases the number of AGJ-containing LC3-labled phagosomes. HeLa cells were transfected with SI-control RNA-oligonucleotides, or with RNA-oligos targeting the autophagy-relevant proteins, LC3/(Atg8), BECN1/(Atg6), LAMP-2, and p62/SQSTM1 (KD) as in . 48 h post oligo transfection cells were transfected with Cx43-GFP cDNA and 24 h later, total number of AGJs (in C), and colocalization with LC3-positive phagosomes (in A and B) was analyzed. (A) BECN1 and p62 KD and SI-control cells were stained with anti-LC3 antibodies 72 h post oligo, and 24 h post Cx43-GFP cDNA transfections. Representative immuno-fluorescence images are shown. Individual and merged fluorescence signals of the boxed areas are shown at higher magnification on the right. Colocalization of Cx43-GFP AGJ vesicles and LC3-positive phagosomes was observed preferentially in the SI-control cells (marked with arrows). Bars = 20 μm. (B) Quantitative analyses of AGJ vesicles (panel 1), LC3-positive autophagosomes (panel 2), and colocalizing AGJ/autophagosomes (panel 3) revealed a significant increase of AGJs, a significant decrease of autophagosomes, and significantly reduced AGJ/autophagosome colocalization in the BECN1 and p62 KD knockdown cells in all three independent experiments (**p < 0.01; ***p < 0.001) (see , and for total counts). (C) Quantitative AGJ vesicle analyses performed 72 h post oligo-transfection indicated a significant cytoplasmic AGJ accumulation in BECN1/(Atg6), LAMP-2, and p62/SQSTM1 depleted cells (≥ 50%, marked with asterisks) compared with SI-control cells. Less pronounced AGJ vesicle-accumulation was observed in LC3-depleted cells (32%), and this was attributed to sufficient inactive LC3-I that may remained in the LC3-KD cells and may have been converted into active LC3-II.
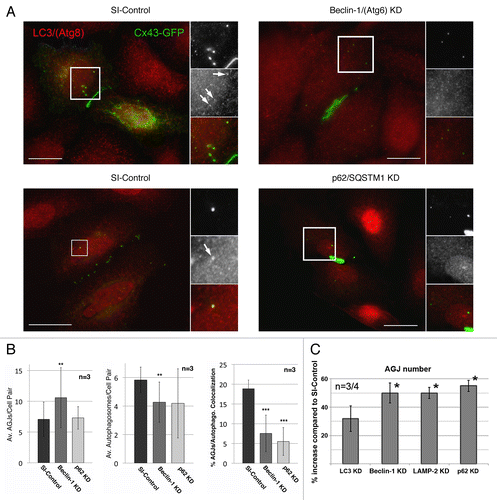
Table 1. AGJ/autophagosome colocalization in SI-Control, Beclin1 and p62 KD cells
Table 2. AGJ/autophagosome colocalization in SI-Control, Beclin1 and p62 KD cells
Table 3. AGJ/autophagosome colocalization in SI-Control, Beclin1 and p62 KD cells
Figure 7. LC3 and p62/SQSTM1 protein colocalize with endogenously expressed Cx43-based GJs and AGJ vesicles. Endogenously Cx43 expressing porcine primary pulmonary artery endothelial cells (PAECs) were stained for Cx43, LC3, and p62/SQSTM1 using specific mono- and polyclonal antibodies, and potential Cx43-LC3/p62 colocalization was qualitatively and quantitatively analyzed. (A) Representative merged fluorescence images of confluent PAECs are shown. Individual and merged fluorescence signals of the boxed areas are shown below at higher magnification. Significant colocalization of LC3 with AGJ vesicles, and of p62 with AGJ vesicles and individual plasma membrane GJs was observed, even at stringent threshold settings (marked with arrows). Bars = 20 μm. (B) Quantitative scatter-blot colocalization analyses of the images shown in (A) with applied maximum intensity threshold settings of 120 (of maximally 250 arbitrary units; white lines) indicated.
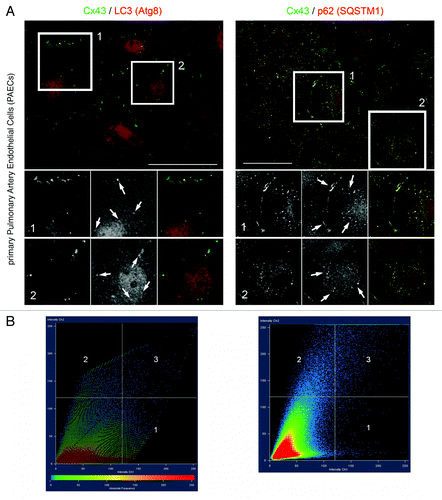
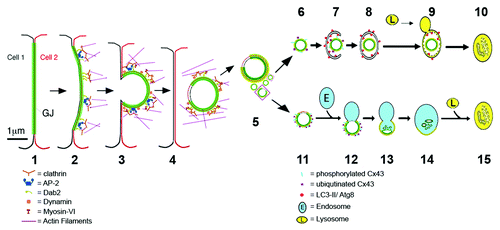
Figure 8. Schematic representation of the proposed steps that lead to GJ internalization (1–3), AGJ vesicle formation and fragmentation (4 and 5), and AGJ vesicle degradation by phago-/lysosomal (6–10) and endo-/lysosomal (11–15) pathways based on the present and previous work by others and us (see text for details).