5,928
Views
201
CrossRef citations to date
0
Altmetric
Translational Research Paper

Autophagy plays a critical role in kidney tubule maintenance, aging and ischemia-reperfusion injury

, , , , , , & show all
Pages 826-837 | Received 15 Nov 2011, Accepted 19 Jan 2012, Published online: 01 May 2012

Figures & data

Figure 1. Autophagic activity in the tubule system. (A) Under basal conditions, only a few autophagosomes can be detected in the tubule system of GFP-LC3 reporter mice. Kidney cryosections were stained with the proximal tubule marker reagent Lotus Tetragonolobus lectin (LTL) and antibodies against the proximal tubule marker AQP1, the thick ascending limb of loop of Henle marker THP and the collecting duct marker AQP2. (B) Twenty-four hours after ischemia/reperfusion injury, the kidney autophagosomes are upregulated predominantly in the proximal tubule colocalizing with LTL and AQP1. Arrows indicate autophagosomes. Glomeruli (marked with “G”) show high basal autophagosomal activity. Scale bars: 50 µm.
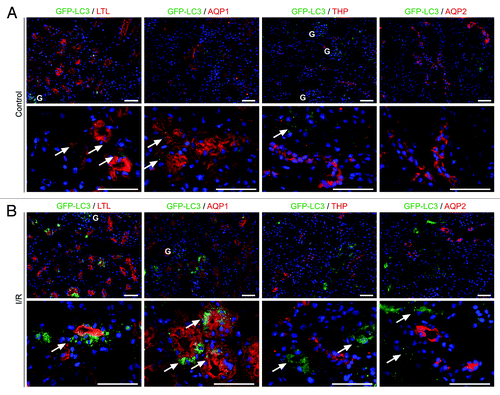
Figure 1. Autophagic activity in the tubule system. (A) Under basal conditions, only a few autophagosomes can be detected in the tubule system of GFP-LC3 reporter mice. Kidney cryosections were stained with the proximal tubule marker reagent Lotus Tetragonolobus lectin (LTL) and antibodies against the proximal tubule marker AQP1, the thick ascending limb of loop of Henle marker THP and the collecting duct marker AQP2. (B) Twenty-four hours after ischemia/reperfusion injury, the kidney autophagosomes are upregulated predominantly in the proximal tubule colocalizing with LTL and AQP1. Arrows indicate autophagosomes. Glomeruli (marked with “G”) show high basal autophagosomal activity. Scale bars: 50 µm.

Figure 2. There is no detectable abnormality in Atg5−/− kidneys at E19.5. (A) Atg5+/− mice, missing exon 3 constitutively in one Atg5 allele, were bred to generate Atg5−/− mice. (B) No obvious histological alterations can be detected in Atg5−/− mice at E19.5. Scale bars: 50 µm.
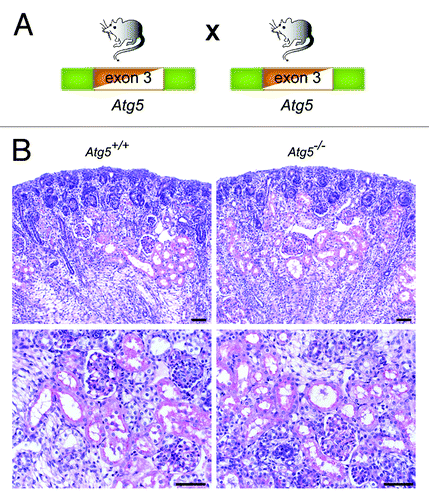
Figure 2. There is no detectable abnormality in Atg5−/− kidneys at E19.5. (A) Atg5+/− mice, missing exon 3 constitutively in one Atg5 allele, were bred to generate Atg5−/− mice. (B) No obvious histological alterations can be detected in Atg5−/− mice at E19.5. Scale bars: 50 µm.

Figure 3. Time-specific deletion of Atg5 in the kidney tubule system results in ultrastructural alterations and increased serum creatinine. (A) Schematic illustration of the generation of doxycycline-inducible kidney tubule-specific Atg5-deficient mice (Atg5flox/flox;Pax8.rtTA;tetO.Cre). (B) Expression of GFP in the tubule system of mT/mG;Pax8.rtTA;tetO.Cre reporter mice 2 weeks after doxycycline induction. (C) Western blot analysis of total kidney lysate confirmed significant reduction of Atg5, almost complete loss of LC3-I to LC3-II conversion and accumulation of p62 4 weeks after doxycycline induction. (D) Densitometric analysis (n = 3 each; *p < 0.05). (E) No obvious histological lesions in Atg5flox/flox;Pax8.rtTA;tetO.Cre 5 mo after doxycycline induction. (F) Ultrastructural analysis revealed accumulation of concentric membrane bodies (arrowheads) in Atg5 deficient proximal tubule cells. (G–I) Significant increased serum creatinine, but no differences in serum urea and urinary NGAL 1 and 5 mo after doxycyclin induction (n = 7–11 Atg5flox/flox;Pax8.rtTA;tetO.Cre mice and n = 6–11 control mice; ***p < 0.001). (J) No significant difference in mouse body weight (male mice, n = 6 Atg5flox/flox;Pax8.rtTA;tetO.Cre mice and n = 6 control mice). Scale bars: 100 µm in (B), 50 µm in (E), 1 µm in (F).
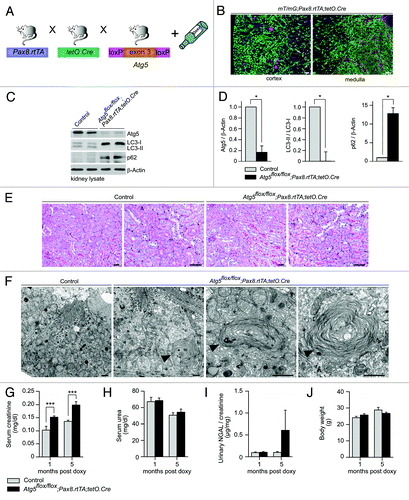
Figure 3. Time-specific deletion of Atg5 in the kidney tubule system results in ultrastructural alterations and increased serum creatinine. (A) Schematic illustration of the generation of doxycycline-inducible kidney tubule-specific Atg5-deficient mice (Atg5flox/flox;Pax8.rtTA;tetO.Cre). (B) Expression of GFP in the tubule system of mT/mG;Pax8.rtTA;tetO.Cre reporter mice 2 weeks after doxycycline induction. (C) Western blot analysis of total kidney lysate confirmed significant reduction of Atg5, almost complete loss of LC3-I to LC3-II conversion and accumulation of p62 4 weeks after doxycycline induction. (D) Densitometric analysis (n = 3 each; *p < 0.05). (E) No obvious histological lesions in Atg5flox/flox;Pax8.rtTA;tetO.Cre 5 mo after doxycycline induction. (F) Ultrastructural analysis revealed accumulation of concentric membrane bodies (arrowheads) in Atg5 deficient proximal tubule cells. (G–I) Significant increased serum creatinine, but no differences in serum urea and urinary NGAL 1 and 5 mo after doxycyclin induction (n = 7–11 Atg5flox/flox;Pax8.rtTA;tetO.Cre mice and n = 6–11 control mice; ***p < 0.001). (J) No significant difference in mouse body weight (male mice, n = 6 Atg5flox/flox;Pax8.rtTA;tetO.Cre mice and n = 6 control mice). Scale bars: 100 µm in (B), 50 µm in (E), 1 µm in (F).

Figure 4. Accumulation of p62 and ubiquitin-positive inclusion bodies in Atg5-deficient tubule cells. (A) Immunohistochemistry staining of kidney sections of Atg5flox/flox;Pax8.rtTA;tetO.Cre mice and control littermates 5 mo after doxycycline induction for p62 and ubiquitin. Arrows indicate p62 or ubiquitin positive inclusion bodies, respectively. (B) Immunofluorescence staining of kidney cryosections as indicated. Arrows mark colocalization of p62 with AQP1, THP and AQP2. Scale bars: 50 µm.
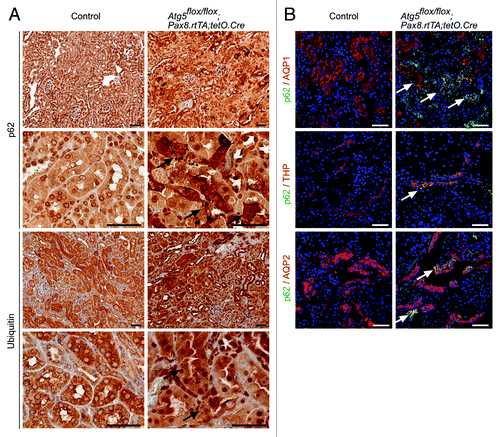
Figure 4. Accumulation of p62 and ubiquitin-positive inclusion bodies in Atg5-deficient tubule cells. (A) Immunohistochemistry staining of kidney sections of Atg5flox/flox;Pax8.rtTA;tetO.Cre mice and control littermates 5 mo after doxycycline induction for p62 and ubiquitin. Arrows indicate p62 or ubiquitin positive inclusion bodies, respectively. (B) Immunofluorescence staining of kidney cryosections as indicated. Arrows mark colocalization of p62 with AQP1, THP and AQP2. Scale bars: 50 µm.

Figure 5. Ischemia/reperfusion results in severe tubular injury in tubule-specific Atg5-deficient kidneys. (A) Two weeks after doxycycline administration Atg5flox/flox;Pax8.rtTA;tetO.Cre mice and control littermates were exposed to ischemia/reperfusion injury. (B) Severe tubular injury in Atg5flox/flox;Pax8.rtTA;tetO.Cre 2 and 7 d after ischemia/reperfusion. Arrows indicate sloughing of tubular cells and tubular lumina filled with detached cells, respectively. (C) Three days after ischemia/reperfusion, ultrastructural analysis revealed increase of autophagosomes and autolysosomes containing mitochondria in control proximal tubular cells. Knockout proximal tubular cells displayed accumulation of damaged mitochondria and concentric membranes surrounding mitochondria, protein aggregates and lipid inclusions. Arrows indicate autophagosomes with their surrounding double membrane and an autolysosome with a single membrane (right), arrowheads indicate concentric membranes, mitochondria are marked with “M” exemplarily, lipid inclusion is marked with “L.” Scale bars: 50 µm in (B), 1 µm in (C).
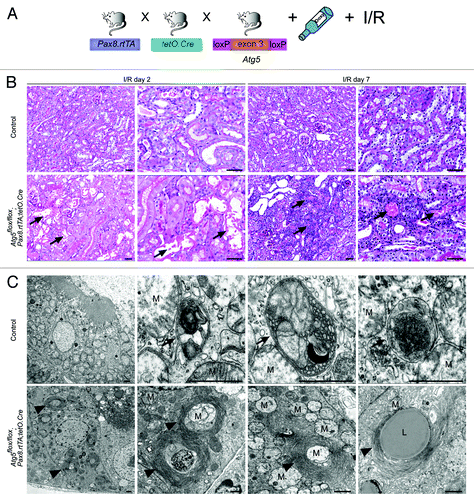
Figure 5. Ischemia/reperfusion results in severe tubular injury in tubule-specific Atg5-deficient kidneys. (A) Two weeks after doxycycline administration Atg5flox/flox;Pax8.rtTA;tetO.Cre mice and control littermates were exposed to ischemia/reperfusion injury. (B) Severe tubular injury in Atg5flox/flox;Pax8.rtTA;tetO.Cre 2 and 7 d after ischemia/reperfusion. Arrows indicate sloughing of tubular cells and tubular lumina filled with detached cells, respectively. (C) Three days after ischemia/reperfusion, ultrastructural analysis revealed increase of autophagosomes and autolysosomes containing mitochondria in control proximal tubular cells. Knockout proximal tubular cells displayed accumulation of damaged mitochondria and concentric membranes surrounding mitochondria, protein aggregates and lipid inclusions. Arrows indicate autophagosomes with their surrounding double membrane and an autolysosome with a single membrane (right), arrowheads indicate concentric membranes, mitochondria are marked with “M” exemplarily, lipid inclusion is marked with “L.” Scale bars: 50 µm in (B), 1 µm in (C).

Figure 6. Characterization of tubular injury after ischemia/reperfusion. (A) Ischemia/reperfusion resulted in transiently elevated serum creatinine, (B) not significantly increased serum urea, (C) albuminuria and (D) massive increased urinary NGAL levels in Atg5flox/flox;Pax8.rtTA;tetO.Cre mice (n = 10 Atg5flox/flox;Pax8.rtTA;tetO.Cre mice and n = 9 control mice; **p < 0.01, *p < 0.05). (E and F) Increased number of apoptotic cells, stained by active caspase-3 antibody and (G and H) accelerated proliferation, marked by Ki-67 antibody, costained with the proximal tubule marker Lotus Tetragonolobus lectin (LTL) in Atg5flox/flox;Pax8.rtTA;tetO.Cre mice 7 d after ischemia/reperfusion (n = 3 each, *p < 0.05, **p < 0.01, ***p < 0.001). No costaining of active caspase-3 or Ki-67 respectively with the thick ascending limb of loop of Henle marker THP could be detected. Scale bars: 50 µm.
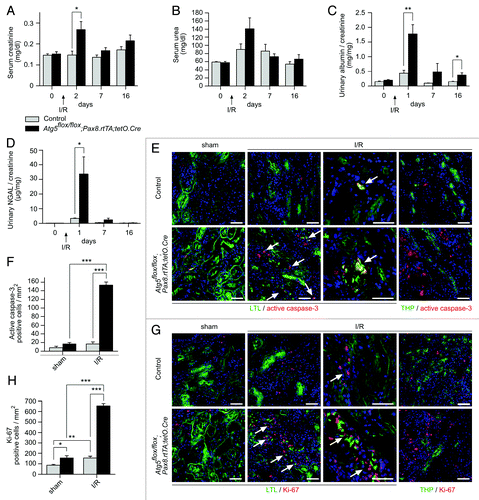
Figure 6. Characterization of tubular injury after ischemia/reperfusion. (A) Ischemia/reperfusion resulted in transiently elevated serum creatinine, (B) not significantly increased serum urea, (C) albuminuria and (D) massive increased urinary NGAL levels in Atg5flox/flox;Pax8.rtTA;tetO.Cre mice (n = 10 Atg5flox/flox;Pax8.rtTA;tetO.Cre mice and n = 9 control mice; **p < 0.01, *p < 0.05). (E and F) Increased number of apoptotic cells, stained by active caspase-3 antibody and (G and H) accelerated proliferation, marked by Ki-67 antibody, costained with the proximal tubule marker Lotus Tetragonolobus lectin (LTL) in Atg5flox/flox;Pax8.rtTA;tetO.Cre mice 7 d after ischemia/reperfusion (n = 3 each, *p < 0.05, **p < 0.01, ***p < 0.001). No costaining of active caspase-3 or Ki-67 respectively with the thick ascending limb of loop of Henle marker THP could be detected. Scale bars: 50 µm.

Figure 7. Distal tubule-specific Atg5 knockout results in accumulation of p62 and oxidative injury markers. (A) Schematic illustration of the generation of distal tubule-specific Atg5-deficient mice (Atg5flox/flox;Ksp-Cre). (B) Expression of GFP in the distal tubule system of mT/mG;Ksp.Cre reporter mice. (C) Western blot of kidney medulla lysate. (D) Densitometric analysis confirmed significant reduction of Atg5, reduced LC3-I to LC3-II conversion and time-dependant accumulation of p62 in kidney medulla of Atg5flox/flox;Ksp-Cre mice (n = 3 each; *p < 0.05, **p < 0.01, ***p < 0.001). (E) No obvious histological lesions in 14-mo-old Atg5flox/flox;Ksp-Cre mice. (F) Costaining of p62 with the proximal tubule marker AQP1, the thick ascending limb of loop of Henle marker THP and the collecting duct marker AQP2. Arrows indicate colocalization of p62 with THP and AQP2, but not with AQP1 in kidney cryosections of 6 mo old Atg5flox/flox;Ksp-Cre mice and control littermates. (G) Immunohistochemistry staining of consecutive kidney sections show accumulation of the oxidative stress markers 4-HNE and nitrotyrosine in the p62 positive tubule segments of 14 mo old Atg5flox/flox;Ksp-Cre mice. Arrows mark serial sections of the same tubule segment. (H–J) No significant differences in serum creatinine, serum urea and urinary NGAL levels of 12 mo old Atg5flox/flox;Ksp-Cre mice and control littermates (n = 8–9 Atg5flox/flox;Ksp-Cre mice and n = 9–11 control mice). (K) No significant difference in mouse body weight (male mice, n = 5 Atg5flox/flox;Ksp-Cre mice and n = 7 control mice). Scale bars: 100 µm in (B), 50 µm in (E–G).
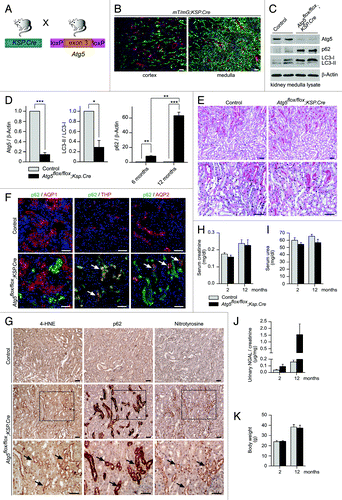
Figure 7. Distal tubule-specific Atg5 knockout results in accumulation of p62 and oxidative injury markers. (A) Schematic illustration of the generation of distal tubule-specific Atg5-deficient mice (Atg5flox/flox;Ksp-Cre). (B) Expression of GFP in the distal tubule system of mT/mG;Ksp.Cre reporter mice. (C) Western blot of kidney medulla lysate. (D) Densitometric analysis confirmed significant reduction of Atg5, reduced LC3-I to LC3-II conversion and time-dependant accumulation of p62 in kidney medulla of Atg5flox/flox;Ksp-Cre mice (n = 3 each; *p < 0.05, **p < 0.01, ***p < 0.001). (E) No obvious histological lesions in 14-mo-old Atg5flox/flox;Ksp-Cre mice. (F) Costaining of p62 with the proximal tubule marker AQP1, the thick ascending limb of loop of Henle marker THP and the collecting duct marker AQP2. Arrows indicate colocalization of p62 with THP and AQP2, but not with AQP1 in kidney cryosections of 6 mo old Atg5flox/flox;Ksp-Cre mice and control littermates. (G) Immunohistochemistry staining of consecutive kidney sections show accumulation of the oxidative stress markers 4-HNE and nitrotyrosine in the p62 positive tubule segments of 14 mo old Atg5flox/flox;Ksp-Cre mice. Arrows mark serial sections of the same tubule segment. (H–J) No significant differences in serum creatinine, serum urea and urinary NGAL levels of 12 mo old Atg5flox/flox;Ksp-Cre mice and control littermates (n = 8–9 Atg5flox/flox;Ksp-Cre mice and n = 9–11 control mice). (K) No significant difference in mouse body weight (male mice, n = 5 Atg5flox/flox;Ksp-Cre mice and n = 7 control mice). Scale bars: 100 µm in (B), 50 µm in (E–G).
Supplemental material

Additional material

Download Zip (4.5 MB)

Reprints and Corporate Permissions

Please note: Selecting permissions does not provide access to the full text of the article, please see our help page How do I view content?

To request a reprint or corporate permissions for this article, please click on the relevant link below:

Academic Permissions

Please note: Selecting permissions does not provide access to the full text of the article, please see our help page How do I view content?

Obtain permissions instantly via Rightslink by clicking on the button below:

If you are unable to obtain permissions via Rightslink, please complete and submit this Permissions form. For more information, please visit our Permissions help page.