12,712
Views
849
CrossRef citations to date
0
Altmetric
Basic Research Paper

MTORC1 functions as a transcriptional regulator of autophagy by preventing nuclear transport of TFEB

, , &
Pages 903-914 | Published online: 11 May 2012

Figures & data

Figure 1. MTORC1 regulates the subcellular distribution of TFEB. (A) Immunofluorescence confocal microscopy showing nuclear localization of recombinant TFEB-Flag in ARPE-19 cells incubated with MTORC1 inhibitors. (B) Quantification of the nuclear localization of TFEB in ARPE-19 cells incubated with different kinase inhibitors. Values are means ± SD of three independent experiments. (C) Immunofluorescence confocal microscopy showing colocalization between TFEB-Flag and MTORC1 in ARPE-19 cells incubated with PP242 for 2 h. (D) Quantification of the lysosomal localization of TFEB in ARPE-19 cells incubated with PP242. (E) Still images of a time-lapse movie showing the sequential association of TFEB-GFP with lysosomes and subsequent accumulation in the nucleus. Scale bars: 10 μm. ***p < 0.001; n.s.: not significant.
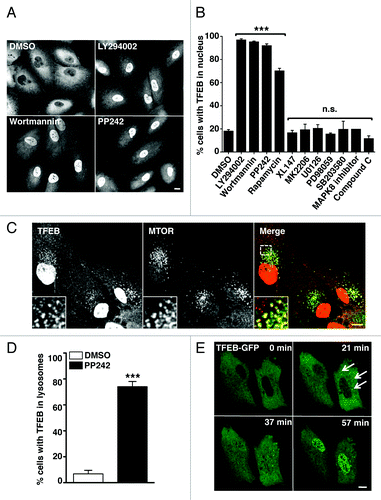
Figure 1. MTORC1 regulates the subcellular distribution of TFEB. (A) Immunofluorescence confocal microscopy showing nuclear localization of recombinant TFEB-Flag in ARPE-19 cells incubated with MTORC1 inhibitors. (B) Quantification of the nuclear localization of TFEB in ARPE-19 cells incubated with different kinase inhibitors. Values are means ± SD of three independent experiments. (C) Immunofluorescence confocal microscopy showing colocalization between TFEB-Flag and MTORC1 in ARPE-19 cells incubated with PP242 for 2 h. (D) Quantification of the lysosomal localization of TFEB in ARPE-19 cells incubated with PP242. (E) Still images of a time-lapse movie showing the sequential association of TFEB-GFP with lysosomes and subsequent accumulation in the nucleus. Scale bars: 10 μm. ***p < 0.001; n.s.: not significant.

Figure 2. Pharmacological or genetic inhibition of MTORC1 induces transport of TFEB to the nucleus. (A) HeLa cells stably expressing TFEB (CF7) were incubated with the indicated kinase inhibitors and the electrophoretic mobility of TFEB was monitored by immunoblotting. (B) Subcellular fractionation of HeLa (CF7) cells incubated with different kinase inhibitors. (C) Immunofluorescence confocal microscopy showing TFEB localization in ARPE-19 cells depleted of either RPTOR or RICTOR. Scale bar: 10 μm. (D) Quantification of the nuclear localization of TFEB in ARPE-19 cells depleted of either RPTOR or RICTOR. Values are means ± SD of three independent experiments. ***p < 0.001, **p < 0.01. (E) Immunoblotting analysis of TFEB electrophoretic mobility in lysates of ARPE-19 cells depleted of either RPTOR or RICTOR.
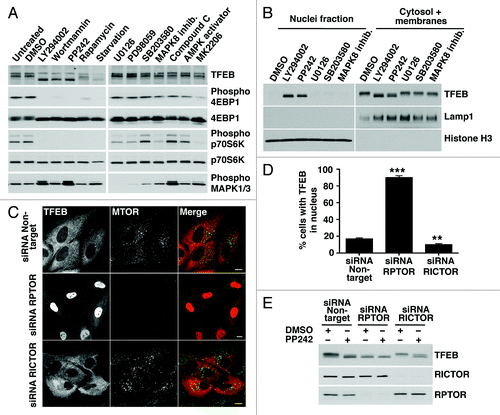
Figure 2. Pharmacological or genetic inhibition of MTORC1 induces transport of TFEB to the nucleus. (A) HeLa cells stably expressing TFEB (CF7) were incubated with the indicated kinase inhibitors and the electrophoretic mobility of TFEB was monitored by immunoblotting. (B) Subcellular fractionation of HeLa (CF7) cells incubated with different kinase inhibitors. (C) Immunofluorescence confocal microscopy showing TFEB localization in ARPE-19 cells depleted of either RPTOR or RICTOR. Scale bar: 10 μm. (D) Quantification of the nuclear localization of TFEB in ARPE-19 cells depleted of either RPTOR or RICTOR. Values are means ± SD of three independent experiments. ***p < 0.001, **p < 0.01. (E) Immunoblotting analysis of TFEB electrophoretic mobility in lysates of ARPE-19 cells depleted of either RPTOR or RICTOR.

Figure 3. S211 is a novel MTORC1-dependent phosphorylation site in TFEB required for the binding to YWHA. (A) Coomassie blue stained SDS-PAGE gel of co-immunopreciptated TFEB and YWHA from HeLa (CF7) cells treated with either DMSO or PP242. The asterisk (*) indicates IgG heavy and light chains. The arrowhead denotes actin. (B) Immunoblotting analysis of immunoprecipitates obtained as in (A). (C) Immunoblotting analysis of immunoprecipitates obtained as in (A) and incubated with or without calf intestinal alkaline phosphatase (CIAP). (D) Multi-sequence alignment of human TFEB S211 phosphorylation site with MITF and TFEB orthologs. (E) Immunoblotting analysis of immunoprecipitates from ARPE-19 cells overexpressing amino acid specific mutants and truncated forms of TFEB. (F) Collision-induced dissociation (CID) spectrum obtained for the TFEB S211 containing peptide (VGVTSSpSCPADL) showing phosphorylation at Serine 211. (G) Extracted ion chromatograms (XIC) of the peptide (m/z = 636.766) from cells treated with either DMSO or PP242.
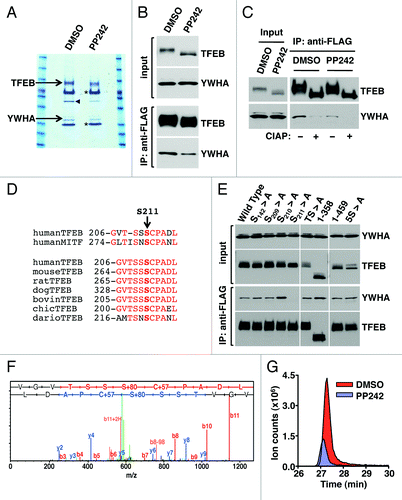
Figure 3. S211 is a novel MTORC1-dependent phosphorylation site in TFEB required for the binding to YWHA. (A) Coomassie blue stained SDS-PAGE gel of co-immunopreciptated TFEB and YWHA from HeLa (CF7) cells treated with either DMSO or PP242. The asterisk (*) indicates IgG heavy and light chains. The arrowhead denotes actin. (B) Immunoblotting analysis of immunoprecipitates obtained as in (A). (C) Immunoblotting analysis of immunoprecipitates obtained as in (A) and incubated with or without calf intestinal alkaline phosphatase (CIAP). (D) Multi-sequence alignment of human TFEB S211 phosphorylation site with MITF and TFEB orthologs. (E) Immunoblotting analysis of immunoprecipitates from ARPE-19 cells overexpressing amino acid specific mutants and truncated forms of TFEB. (F) Collision-induced dissociation (CID) spectrum obtained for the TFEB S211 containing peptide (VGVTSSpSCPADL) showing phosphorylation at Serine 211. (G) Extracted ion chromatograms (XIC) of the peptide (m/z = 636.766) from cells treated with either DMSO or PP242.

Figure 4. Dissociation of the TFEB/YWHA complex results in transport of TFEB to the nucleus and increased expression of autophagic and lysosomal genes. (A) Immunofluorescence confocal microscopy showing nuclear and late endosomal/lysosomal localization of TFEB-S211A in ARPE-19 cells. (B) Quantification of the nuclear localization of TFEB as shown in (A). Values are means ± SD of five independent experiments. (C–F) Relative quantitative RT-PCR analysis of the mRNA expression of autophagy (ATG9B and UVRAG) and lysosomal (LAMP1 and MCOLN1) genes in ARPE-19 cells infected with control adenovirus (Null) or adenovirus expressing TFEB-wt or TFEB-S211A. Values are means ± SD of three independent experiments. Scale bar: 10 μm. ***p < 0.001; **p < 0.01; *p < 0.05; n.s., not significant.
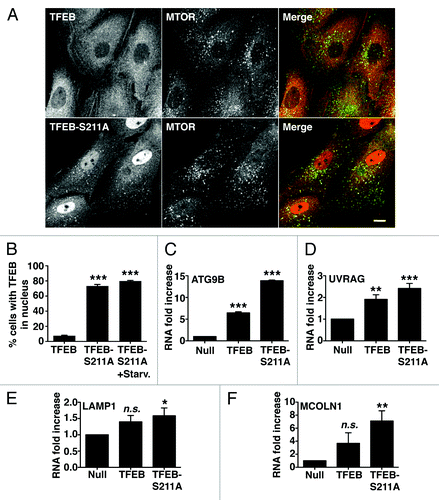
Figure 4. Dissociation of the TFEB/YWHA complex results in transport of TFEB to the nucleus and increased expression of autophagic and lysosomal genes. (A) Immunofluorescence confocal microscopy showing nuclear and late endosomal/lysosomal localization of TFEB-S211A in ARPE-19 cells. (B) Quantification of the nuclear localization of TFEB as shown in (A). Values are means ± SD of five independent experiments. (C–F) Relative quantitative RT-PCR analysis of the mRNA expression of autophagy (ATG9B and UVRAG) and lysosomal (LAMP1 and MCOLN1) genes in ARPE-19 cells infected with control adenovirus (Null) or adenovirus expressing TFEB-wt or TFEB-S211A. Values are means ± SD of three independent experiments. Scale bar: 10 μm. ***p < 0.001; **p < 0.01; *p < 0.05; n.s., not significant.

Figure 5. TFEB-S211A induces accumulation of autophagosomes. Immunofluorescence confocal microscopy showing autophagosome accumulation (A) and increased cytosolic SQSTM1 (B) in ARPE-19 cells overexpressing TFEB-S211A. (C) Immunoblotting of ARPE-19 cell lysates infected with either adenovirus Null or adenovirus expressing TFEB-wt or TFEB-S211A. Protein bands were detected using the indicated antibodies. (D–I) Quantification of protein bands as shown in (C). Bars represent the ratio of LAMP1/actin (D), UVRAG/actin (E), SQSTM1/actin (F), LC3II/LC3I (G), LC3II/actin (H), and TFEB-Flag/actin (I) expressed as fold increase of the ratio from cells infected with adenovirus Null. Values are means ± SD of three independent experiments. Scale bar: 10 μm. ***p < 0.001, **p < 0.01, *p < 0.05.
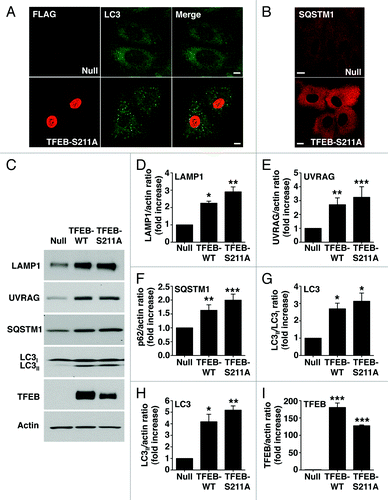
Figure 5. TFEB-S211A induces accumulation of autophagosomes. Immunofluorescence confocal microscopy showing autophagosome accumulation (A) and increased cytosolic SQSTM1 (B) in ARPE-19 cells overexpressing TFEB-S211A. (C) Immunoblotting of ARPE-19 cell lysates infected with either adenovirus Null or adenovirus expressing TFEB-wt or TFEB-S211A. Protein bands were detected using the indicated antibodies. (D–I) Quantification of protein bands as shown in (C). Bars represent the ratio of LAMP1/actin (D), UVRAG/actin (E), SQSTM1/actin (F), LC3II/LC3I (G), LC3II/actin (H), and TFEB-Flag/actin (I) expressed as fold increase of the ratio from cells infected with adenovirus Null. Values are means ± SD of three independent experiments. Scale bar: 10 μm. ***p < 0.001, **p < 0.01, *p < 0.05.

Figure 6. TFEB interacts with the MTORC1 complex. (A) HeLa (CF7) cells treated with either DMSO or Torin-1 (250 nM) for 1 h at 37°C were lysed and TFEB-Flag was immunoprecipitated using anti-FLAG antibody. Immunoprecipitates were then subjected to immunoblotting analysis using the indicated antibodies against components of the MTORC1 complex and RAB7. Note that inputs represent 3% of the total lysates and immunoprecipitated TFEB represents 10% of the total immunoprecipitated material. (B) Model depicting the proposed mechanistic regulation of TFEB by MTORC1.
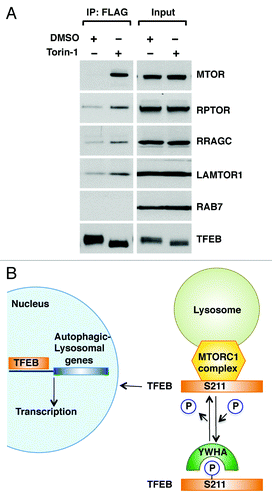
Figure 6. TFEB interacts with the MTORC1 complex. (A) HeLa (CF7) cells treated with either DMSO or Torin-1 (250 nM) for 1 h at 37°C were lysed and TFEB-Flag was immunoprecipitated using anti-FLAG antibody. Immunoprecipitates were then subjected to immunoblotting analysis using the indicated antibodies against components of the MTORC1 complex and RAB7. Note that inputs represent 3% of the total lysates and immunoprecipitated TFEB represents 10% of the total immunoprecipitated material. (B) Model depicting the proposed mechanistic regulation of TFEB by MTORC1.
Supplemental material

Additional material

Download Zip (34 MB)

Reprints and Corporate Permissions

Please note: Selecting permissions does not provide access to the full text of the article, please see our help page How do I view content?

To request a reprint or corporate permissions for this article, please click on the relevant link below:

Academic Permissions

Please note: Selecting permissions does not provide access to the full text of the article, please see our help page How do I view content?

Obtain permissions instantly via Rightslink by clicking on the button below:

If you are unable to obtain permissions via Rightslink, please complete and submit this Permissions form. For more information, please visit our Permissions help page.