1,228
Views
24
CrossRef citations to date
0
Altmetric
Basic Research Paper

KCS1 deletion in Saccharomyces cerevisiae leads to a defect in translocation of autophagic proteins and reduces autophagosome formation

, , , &
Pages 1300-1311 | Received 24 Aug 2011, Accepted 08 May 2012, Published online: 14 Aug 2012

Figures & data

Figure 1. Deletion of genes required for generation of inositol polyphosphates reduces autophagic degradation under nitrogen starvation. (A) The inositol polyphosphate pathway. (B) Immunoblotting assay for GFP-Atg8 processing upon nitrogen deprivation. The inositol polyphosphate mutant strains (ipk2Δ, ipk1Δ, kcs1Δ, vip1Δ, ddp1Δ) as well as control wild-type and atg5Δ strains were transformed with the pCuGFP-Atg8(416) expression plasmid. Cells were grown to mid-log phase in minimal medium (0 h) followed by nitrogen starvation with synthetic dextrose medium minus nitrogen for six h (6 h SD-N). Mid-log phase cells (0 h) or cells that underwent six-hour nitrogen deprivation (6 h SD-N) were analyzed for vacuolar processing of the GFP fusion protein using immunoblotting analysis with an antibody against GFP. The levels of Pgk1 served as loading controls. (C) Vacuolar alkaline phosphatase (ALP) assay to quantify autophagy activity upon nitrogen starvation. Wild-type (WT) and inositol polyphosphate mutant strains expressing Pho8Δ60 were grown in YPD and shifted to SD-N for 4 h. Samples were collected and protein extracts were assayed for alkaline phosphatase activity. The value of SD-N 4 h in the wild-type strain was set to 100% (D) Vacuolar alkaline phosphatase assay to quantify autophagy activity upon rapamycin treatment. Wild-type (WT), atg1Δ (negative control) and the kcs1Δ cells expressing Pho8Δ60 were grown in YPD to early log phase (0 h) and treated with rapamycin (0.2 μg/ml, dissolved in DMSO) for 4 h. Samples were collected and protein extracts were assayed for phosphatase activity. The value for the wild-type strain was set to 100%. (E) Immunoblotting assay for GFP-Atg8 processing upon rapamycin (Rap) treatment. Wild-type (WT), atg5Δ (negative control), and the kcs1Δ mutant transformed with pCuGFP-Atg8(416) were grown to early log phase (0 h) in minimal medium and treated with the TOR inhibitor rapamycin (0.2 μg/ml, dissolved in DMSO) for 4 h. Strains were analyzed for vacuolar processing of the GFP fusion protein using an antibody against GFP. (F) Immunoblotting assay for Ape1 processing. Wild-type, kcs1Δ and atg5Δ cells were grown to mid log phase and starved for 2 h. Samples were collected and protein extracts were analyzed by western analysis with the Ape1 antibody. These data are representative results from three independent experiments.
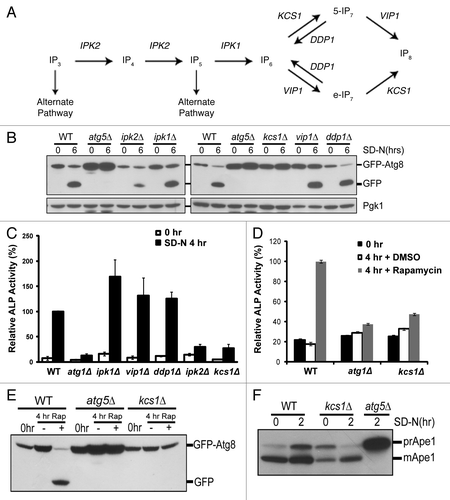
Figure 1. Deletion of genes required for generation of inositol polyphosphates reduces autophagic degradation under nitrogen starvation. (A) The inositol polyphosphate pathway. (B) Immunoblotting assay for GFP-Atg8 processing upon nitrogen deprivation. The inositol polyphosphate mutant strains (ipk2Δ, ipk1Δ, kcs1Δ, vip1Δ, ddp1Δ) as well as control wild-type and atg5Δ strains were transformed with the pCuGFP-Atg8(416) expression plasmid. Cells were grown to mid-log phase in minimal medium (0 h) followed by nitrogen starvation with synthetic dextrose medium minus nitrogen for six h (6 h SD-N). Mid-log phase cells (0 h) or cells that underwent six-hour nitrogen deprivation (6 h SD-N) were analyzed for vacuolar processing of the GFP fusion protein using immunoblotting analysis with an antibody against GFP. The levels of Pgk1 served as loading controls. (C) Vacuolar alkaline phosphatase (ALP) assay to quantify autophagy activity upon nitrogen starvation. Wild-type (WT) and inositol polyphosphate mutant strains expressing Pho8Δ60 were grown in YPD and shifted to SD-N for 4 h. Samples were collected and protein extracts were assayed for alkaline phosphatase activity. The value of SD-N 4 h in the wild-type strain was set to 100% (D) Vacuolar alkaline phosphatase assay to quantify autophagy activity upon rapamycin treatment. Wild-type (WT), atg1Δ (negative control) and the kcs1Δ cells expressing Pho8Δ60 were grown in YPD to early log phase (0 h) and treated with rapamycin (0.2 μg/ml, dissolved in DMSO) for 4 h. Samples were collected and protein extracts were assayed for phosphatase activity. The value for the wild-type strain was set to 100%. (E) Immunoblotting assay for GFP-Atg8 processing upon rapamycin (Rap) treatment. Wild-type (WT), atg5Δ (negative control), and the kcs1Δ mutant transformed with pCuGFP-Atg8(416) were grown to early log phase (0 h) in minimal medium and treated with the TOR inhibitor rapamycin (0.2 μg/ml, dissolved in DMSO) for 4 h. Strains were analyzed for vacuolar processing of the GFP fusion protein using an antibody against GFP. (F) Immunoblotting assay for Ape1 processing. Wild-type, kcs1Δ and atg5Δ cells were grown to mid log phase and starved for 2 h. Samples were collected and protein extracts were analyzed by western analysis with the Ape1 antibody. These data are representative results from three independent experiments.

Figure 2. Deletion of KCS1 affects autophagosome biogenesis analyzed by fluorescent microscopy. (A) Fluorescent microscopic analysis of mid-log phase cells (Mid-log) and the six-hour nitrogen deprived cells (SD-N) from the wild-type and kcs1Δ cells transformed with pCuGFP-Atg8(416). The atg5Δ and vps18Δ mutants were used as negative controls. Scale bar: 1.6 μm. (B) Accumulation of cytoplasmic GFP-Atg8 puncta in wild-type (WT), atg5Δ, kcs1Δ and vps18Δ cells after growing in SD-N medium for 6 h. **p < 0.01. The data are representative results from three independent experiments.
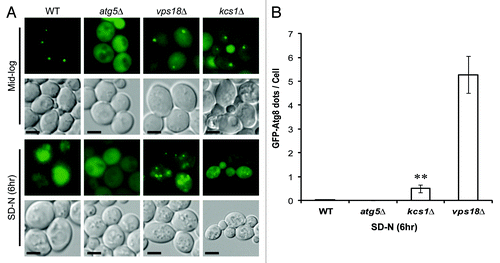
Figure 2. Deletion of KCS1 affects autophagosome biogenesis analyzed by fluorescent microscopy. (A) Fluorescent microscopic analysis of mid-log phase cells (Mid-log) and the six-hour nitrogen deprived cells (SD-N) from the wild-type and kcs1Δ cells transformed with pCuGFP-Atg8(416). The atg5Δ and vps18Δ mutants were used as negative controls. Scale bar: 1.6 μm. (B) Accumulation of cytoplasmic GFP-Atg8 puncta in wild-type (WT), atg5Δ, kcs1Δ and vps18Δ cells after growing in SD-N medium for 6 h. **p < 0.01. The data are representative results from three independent experiments.

Figure 3. Deletion of KCS1 affects autophagosome biogenesis analyzed by electron microscopy. (A) Representative electron microscopic pictures of wild-type (WT) and kcs1Δ mutant cells after a 4 h incubation in SD-N medium in the presence of 1 mM PMSF. N, nucleus; AB, autophagic body; M, mitochondria; V, vacuole. Scale bars: 500 nm. Arrow pointing to an untypical autophagosome. (B) Quantification of the number of autophagic bodies per cell and per vacuole. Total cells analyzed: wild-type (n = 125) and kcs1Δ (n = 129). (C) Size distribution of autophagic body in wild-type and kcs1Δ cells. Size of autophagic bodies (diameter in nm) were measured using the ImageJ software.
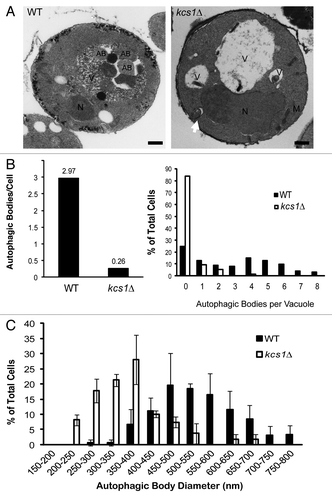
Figure 3. Deletion of KCS1 affects autophagosome biogenesis analyzed by electron microscopy. (A) Representative electron microscopic pictures of wild-type (WT) and kcs1Δ mutant cells after a 4 h incubation in SD-N medium in the presence of 1 mM PMSF. N, nucleus; AB, autophagic body; M, mitochondria; V, vacuole. Scale bars: 500 nm. Arrow pointing to an untypical autophagosome. (B) Quantification of the number of autophagic bodies per cell and per vacuole. Total cells analyzed: wild-type (n = 125) and kcs1Δ (n = 129). (C) Size distribution of autophagic body in wild-type and kcs1Δ cells. Size of autophagic bodies (diameter in nm) were measured using the ImageJ software.

Figure 4. Loss of Kcs1 affects localization of phagophore assembly site. Fluorescence microscopy pictures of wild-type or kcs1Δ cells in (A) mid-log growth phase or (B) 4 h SD-N nitrogen starvation. Wild-type or kcs1Δ cells transformed with pCuGFP-Atg8(416) were either grown to mid-log phase (A), or further followed by 4 h SD-N nitrogen starvation (B). Cells were then stained with FM 4–64 to label vacuolar membrane. Arrows indicate GFP-Atg8 puncta. Scale bar: 2.5 μm. (C) Percentage of cells containing GFP-Atg8 puncta in mid-log growth phase. Approximately 400 cells were analyzed. *p < 0.05. (D) Quantification of colocalization between GFP-Atg8 puncta and vacuolar membrane in either wild-type or kcs1Δ cells under mid-log phase or nitrogen starvation condition as indicated. The data are representative results from three independent experiments. ***p < 0.001.
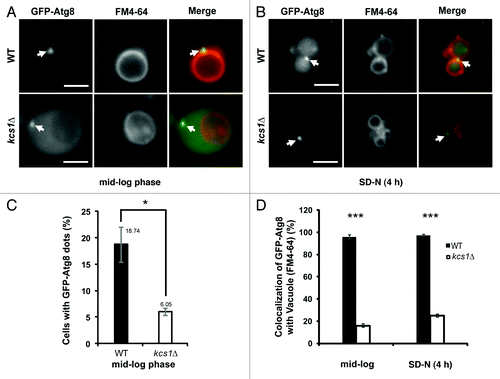
Figure 4. Loss of Kcs1 affects localization of phagophore assembly site. Fluorescence microscopy pictures of wild-type or kcs1Δ cells in (A) mid-log growth phase or (B) 4 h SD-N nitrogen starvation. Wild-type or kcs1Δ cells transformed with pCuGFP-Atg8(416) were either grown to mid-log phase (A), or further followed by 4 h SD-N nitrogen starvation (B). Cells were then stained with FM 4–64 to label vacuolar membrane. Arrows indicate GFP-Atg8 puncta. Scale bar: 2.5 μm. (C) Percentage of cells containing GFP-Atg8 puncta in mid-log growth phase. Approximately 400 cells were analyzed. *p < 0.05. (D) Quantification of colocalization between GFP-Atg8 puncta and vacuolar membrane in either wild-type or kcs1Δ cells under mid-log phase or nitrogen starvation condition as indicated. The data are representative results from three independent experiments. ***p < 0.001.

Figure 5. Loss of Kcs1 affects Atg18-GFP and mRFP-2XFYVE translocation. (A) Intracellular translocation of Atg18 upon nitrogen starvation. Wild-type and kcs1Δ cells were transformed with an Atg18-GFP plasmid and grown to mid-log phase in minimal media minus URA. Cells were then nitrogen starved up to 4 h in SD-N and analyzed by fluorescence microscopy. (B) Intracellular PtdIns3P distribution analyzed by mRFP-2XFYVE binding. Wild-type and kcs1Δ cells were transformed with mRFP-2XFYVE plasmid and grown to mid log phase in minimal media minus URA. Cells were then nitrogen starved up to 4 h in SD-N and analyzed by fluorescence microscopy. Fluorescent pictures are representative images from two independent results. Scale bars: 1.6 μm.
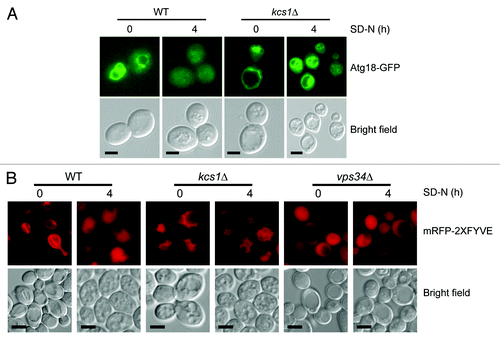
Figure 5. Loss of Kcs1 affects Atg18-GFP and mRFP-2XFYVE translocation. (A) Intracellular translocation of Atg18 upon nitrogen starvation. Wild-type and kcs1Δ cells were transformed with an Atg18-GFP plasmid and grown to mid-log phase in minimal media minus URA. Cells were then nitrogen starved up to 4 h in SD-N and analyzed by fluorescence microscopy. (B) Intracellular PtdIns3P distribution analyzed by mRFP-2XFYVE binding. Wild-type and kcs1Δ cells were transformed with mRFP-2XFYVE plasmid and grown to mid log phase in minimal media minus URA. Cells were then nitrogen starved up to 4 h in SD-N and analyzed by fluorescence microscopy. Fluorescent pictures are representative images from two independent results. Scale bars: 1.6 μm.

Table 1. Ratiometric measurement of Atg18-GFP signal present on the vacuolar membrane vs. that of the cytosol in mid-log and SD-N 4hr growth condition

Figure 6. Formation of double-membrane, autophagosome-like structures from cytoplasmic membrane in kcs1Δ cells. Electron microscopic analysis of kcs1Δ cells upon nitrogen deprivation. (A) Pictures show the different stages in the process of the formation of double-membrane, autophagosome-like vesicles from plasma membrane. Each picture (1 to 10) represents a different stage of the double-membrane, autophagosome-like structure formation in different cells. (B) Pictures represent typical sealed autophagosome-like vesicles in proximity to plasma membrane. (C) Pictures represent typical autophagosome-like vesicles in proximity to plasma membrane that have not completely closed. (D) EM pictures represent typical wild-type, kcs1Δ or kcs1Δ atg5Δ mutant cells after SD-N 4 h starvation. The arrowheads show intrusions on the plasma membrane. The plot shows quantification of the number of intrusions at the plasma membrane in wild-type, kcs1Δ or kcs1Δ atg5Δ mutant cells after 4 h SD-N nitrogen starvation. A total of 50 cells from each strain were analyzed. Scale bars: (A–C) 100 nm; (D) 500 nm.
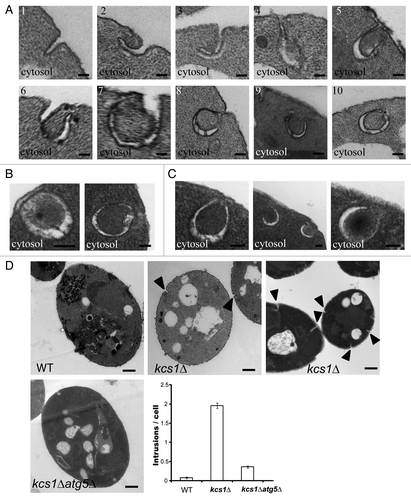
Figure 6. Formation of double-membrane, autophagosome-like structures from cytoplasmic membrane in kcs1Δ cells. Electron microscopic analysis of kcs1Δ cells upon nitrogen deprivation. (A) Pictures show the different stages in the process of the formation of double-membrane, autophagosome-like vesicles from plasma membrane. Each picture (1 to 10) represents a different stage of the double-membrane, autophagosome-like structure formation in different cells. (B) Pictures represent typical sealed autophagosome-like vesicles in proximity to plasma membrane. (C) Pictures represent typical autophagosome-like vesicles in proximity to plasma membrane that have not completely closed. (D) EM pictures represent typical wild-type, kcs1Δ or kcs1Δ atg5Δ mutant cells after SD-N 4 h starvation. The arrowheads show intrusions on the plasma membrane. The plot shows quantification of the number of intrusions at the plasma membrane in wild-type, kcs1Δ or kcs1Δ atg5Δ mutant cells after 4 h SD-N nitrogen starvation. A total of 50 cells from each strain were analyzed. Scale bars: (A–C) 100 nm; (D) 500 nm.
Supplemental material

Additional material

Download Zip (176.2 KB)

Reprints and Corporate Permissions

Please note: Selecting permissions does not provide access to the full text of the article, please see our help page How do I view content?

To request a reprint or corporate permissions for this article, please click on the relevant link below:

Academic Permissions

Please note: Selecting permissions does not provide access to the full text of the article, please see our help page How do I view content?

Obtain permissions instantly via Rightslink by clicking on the button below:

If you are unable to obtain permissions via Rightslink, please complete and submit this Permissions form. For more information, please visit our Permissions help page.