Figures & data
Figure 1. Structure of WST11.
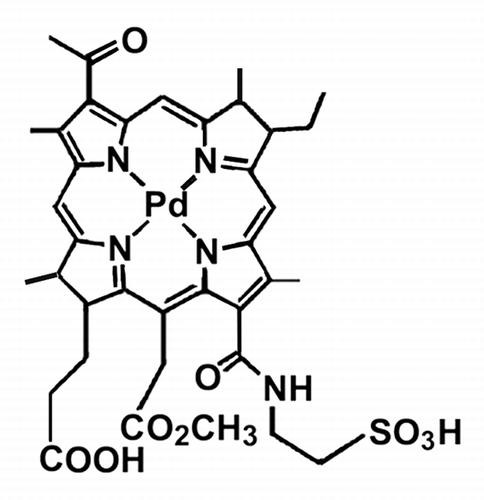
Figure 2. Subcellular localization of WST11 and effects on LTR fluorescence. Fluorescence localization patterns of WST11 in WT (A) or ATG7 KD (B) cultures after a 16 h incubation with 1 μM drug. (C–F) Effects of photodamage on the pattern of LTR fluorescence. Wild-type (C and E) or ATG7 KD cultures (D and F) were photosensitized with 1 μM WST11 for 16 h, then treated with LTR for 10 min before (C and D) or directly after (E and F) irradiation (90 mJ/cm2). White bar in (A): 20 μm. Photographs are representative of observations for three independent experiments.
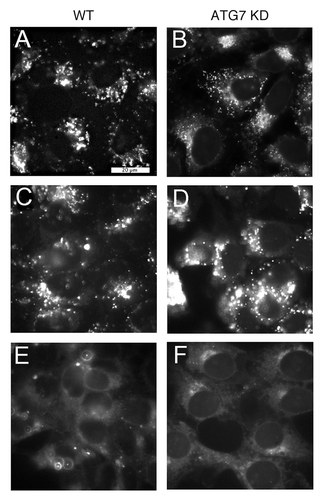
Figure 3. Effects of WST11 and NPe6 on 1c1c7 survival. Cultures of wild type (●, ○), ATG7 KD (■, □), and ATG5 KD (△) 1c1c7 cells were sensitized with 1 μM WST11 for 16 h (●, ■, △) or 20 μM NPe6 for 1 h (○, □) prior to being irradiated for different lengths of time to achieve the indicated light doses. Results with ATG5 KD cells are indicated by a dashed line. Colonies of 30 or more cells were determined 5 d later. Data are normalized to no-treatment controls and represent mean ± SD of three determinations. Similar results were obtained in a second independent experiment.
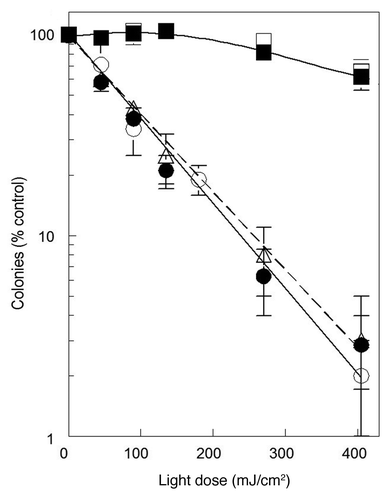
Figure 4. WST11 induced vacuolization. Cultures of wild-type (A–C), ATG7 KD (D–F) and ATG5 KD (G–I) 1c1c7 cells were incubated with 1 μM WST11 for 16 h prior to irradiation with light doses of 0 (A–G), 90 mJ/cm2 (B,E and H), or 405 mJ/cm2 (C, F and I). Images were captured 2 h after irradiation. Bar in (A): 20 μm. Images are representative of three independent experiments.
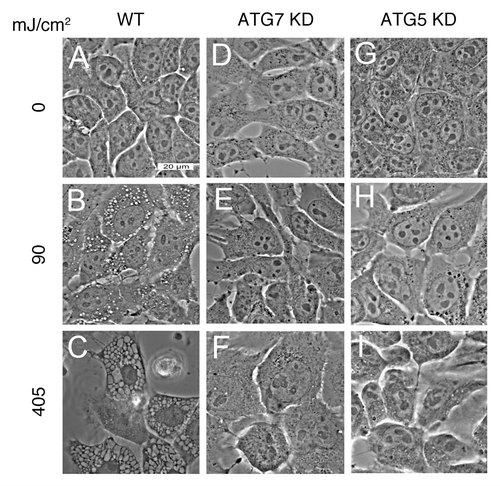
Figure 5. WST11 induction of autophagy. Cultures of GFP-LC3-expressing wild-type 1c1c7 cells were incubated with 1 μM WST11 for 16 h prior to being imaged by phase and fluorescence microscopy immediately prior to (A and B), 1 h (C and D) or 4 h (E and F) after irradiation (405 mJ/cm2). White bars: (A and B) 20 μm; (C–F) 15 μm. (G) Electron micrograph of representative autophagosomes found in WT 1c1c7 cultures loaded with 1 μM WST11 for 16 h and fixed for processing 4 h after irradiation with 405 mJ/cm2. White bar: 0.2 μm. (H) Western blot analysis of LC3 and actin in untreated WT (lane 1) or ATG7 KD (lane 2) cells. Alternatively, WT (lanes 3 and 4) and ATG7 KD cells (lanes 5 and 6) were incubated for 16 h with WST11 prior to exposure to a 405-J/cm2 light dose. NH4Cl (50 mM) was added to some cultures immediately after irradiation (lanes 4 and 6). All cultures were harvested 2 h after irradiation. Similar results were obtained in a second independent study.
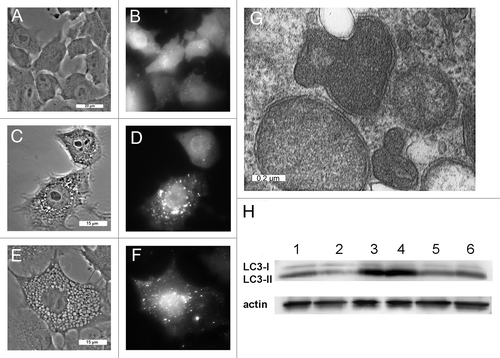
Figure 6. Effects of WST11 PDT on nuclear morphology and procaspase activation. (A) Cultures of wild-type (a–g) and ATG7 KD (h–n) 1c1c7 cells were loaded with 1 μM WST11 for 16 h prior to no treatment, or irradiation (90 or 405 mJ/cm2). Cultures were subsequently incubated with HO33342 for 10 min prior to being imaged 1, 4 or 24 h after irradiation. With the exceptions of (g) and the right half of (f), all other images are of adherent cells. (g) and the right half of (f) are images of HO33342 stained non-adherent floating cells which constitute ~50% and > 95% of all the cells in the plates, respectively. Arrows in (e) point to nuclei with condensed chromatin. Bar in (a): 20 μm. (B) Cultures of wild-type (●, ○), ATG7 KD (▲) or ATG5 KD (■) 1c1c7 cells were treated with 1 μM WST11 for 16 h or with 20 μM NPe6 for 1 h prior to irradiation with either 90 mJ/cm2 (○) or 405 mJ/cm2 (●,▲, ■). Cultures were harvested at specified times after irradiation for analyses of DEVDase activity. Data represent means ± SD of three analyses at each time point for all treatment groups. Similar results were obtained in a second independent study.
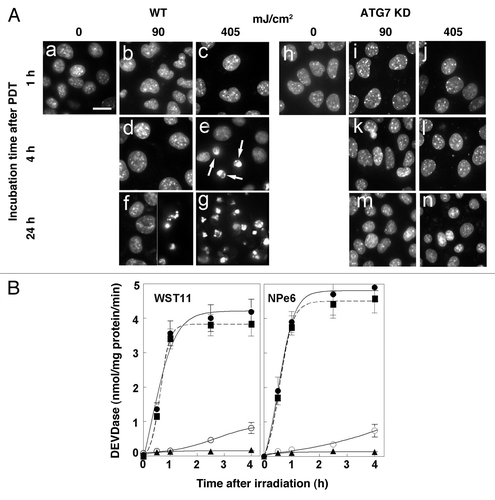
Figure 7. Effects of WST11 PDT on LTR labeling. WT, ATG5 KD and ATG7 KD cultures were left untreated (a, e and i) or incubated with 1 µM WST11 for 16 h prior to being irradiated (405 mJ/cm2), and labeled with LTR immediately (b ,f and j), 4 h (c, g and k) or 16 h (d, h and l) after irradiation. Bar in (a): 20 μm.
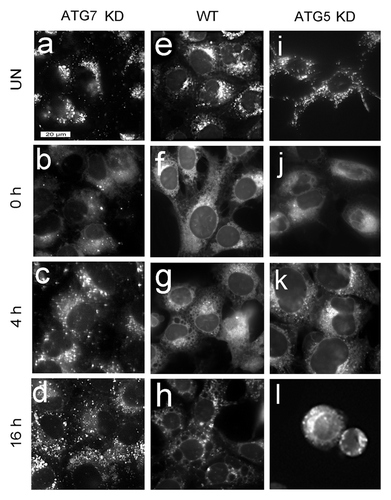
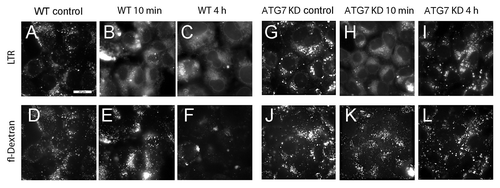
Figure 8. Analyses of lysosomal permeabilization following NPe6 PDT. Cultures of WT (A–F) and ATG7 KD (G–L) cells were preloaded with fluorescein-conjugated 10-kDa dextran polymers as described in Materials and Methods prior to being sensitized with 20 μM NPe6 and irradiated (270 mJ/cm2). LTR was added to the cultures 10 min prior to imaging. LTR (A–C and G–I) and dextran (D–F and J–L) fluorescence were captured 10 min and 4 h after irradiation. Similar results were obtained in a second study.