2,253
Views
48
CrossRef citations to date
0
Altmetric
Translational Research Paper

Inhibition of autophagy as a therapeutic strategy of iron-induced brain injury after hemorrhage

, , , , , , & show all
Pages 1510-1520 | Received 19 Mar 2012, Accepted 27 Jun 2012, Published online: 22 Aug 2012

Figures & data

Figure 1. E2 pretreatment decreases FC-induced autophagy, injury, autophagic cell death and neurotoxicity in PC12 cells. (A) Autophagy was induced after FC exposure and E2 significantly decreased FC-induced autophagy. (B) FC induced the neuronal injury and E2 significantly decreased the FC-induced neuronal injury. (C) E2 significantly decreased FC-induced autophagic cell death. Cells were stained by TUNEL and BECN1 for DNA damage (green) and autophagy (red), respectively. Nuclei were stained by DAPI. The TUNEL(+) Beclin 1 immunoreactive cells with an intact nucleus in PC12 cells pretreated with or without E2 before FC exposure depict an index of autophagic cell death as indicated by arrows in the merged view. (D) FC increased the number of dead cells and E2 significantly increased the number of living cells after FC exposure. Data are expressed as means ± SD (n = 6), *p < 0.05, p** < 0.01.
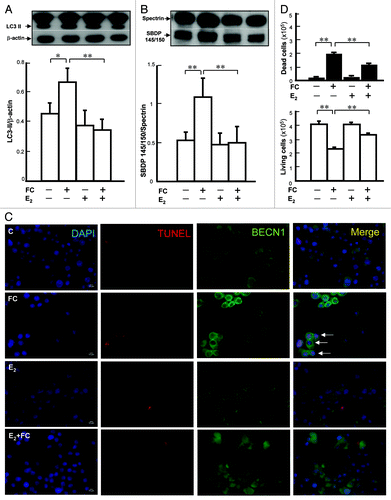
Figure 1. E2 pretreatment decreases FC-induced autophagy, injury, autophagic cell death and neurotoxicity in PC12 cells. (A) Autophagy was induced after FC exposure and E2 significantly decreased FC-induced autophagy. (B) FC induced the neuronal injury and E2 significantly decreased the FC-induced neuronal injury. (C) E2 significantly decreased FC-induced autophagic cell death. Cells were stained by TUNEL and BECN1 for DNA damage (green) and autophagy (red), respectively. Nuclei were stained by DAPI. The TUNEL(+) Beclin 1 immunoreactive cells with an intact nucleus in PC12 cells pretreated with or without E2 before FC exposure depict an index of autophagic cell death as indicated by arrows in the merged view. (D) FC increased the number of dead cells and E2 significantly increased the number of living cells after FC exposure. Data are expressed as means ± SD (n = 6), *p < 0.05, p** < 0.01.

Figure 2. Involvement of autophagy in E2-mediated neuroprotection against FC-induced neurotoxicity in PC12 cells. (A) Atg7 silencing decreased the levels of both constitutive and FC-induced autophagy. The differentiated PC12 cells were pretreated with 100 nM Atg7 siRNA or nontargeted siRNA for 24 h followed by E2 treatment for another 24 h. Subsequently, cells were exposed to FC. (B) Atg7 silencing simulated the protective effect of E2 against the FC-induced cytotoxicity. (C) Preincubation with rapamycin significantly increased the levels of autophagy in each group except for FC-exposure group per se. The differentiated PC12 cells were pretreated with E2 followed by FC exposure. Five hours before FC exposure, the cells were preincubated with 25 nM rapamycin. (D) Preincubation with rapamycin significantly diminished the protective effect of E2 against FC-induced neurotoxicity. Data are expressed as means ± SD (n = 6), *p < 0.05, **p < 0.01.
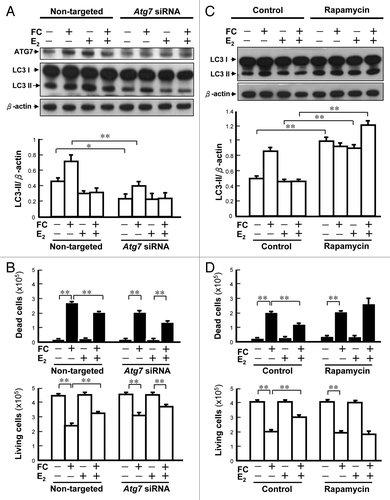
Figure 2. Involvement of autophagy in E2-mediated neuroprotection against FC-induced neurotoxicity in PC12 cells. (A) Atg7 silencing decreased the levels of both constitutive and FC-induced autophagy. The differentiated PC12 cells were pretreated with 100 nM Atg7 siRNA or nontargeted siRNA for 24 h followed by E2 treatment for another 24 h. Subsequently, cells were exposed to FC. (B) Atg7 silencing simulated the protective effect of E2 against the FC-induced cytotoxicity. (C) Preincubation with rapamycin significantly increased the levels of autophagy in each group except for FC-exposure group per se. The differentiated PC12 cells were pretreated with E2 followed by FC exposure. Five hours before FC exposure, the cells were preincubated with 25 nM rapamycin. (D) Preincubation with rapamycin significantly diminished the protective effect of E2 against FC-induced neurotoxicity. Data are expressed as means ± SD (n = 6), *p < 0.05, **p < 0.01.
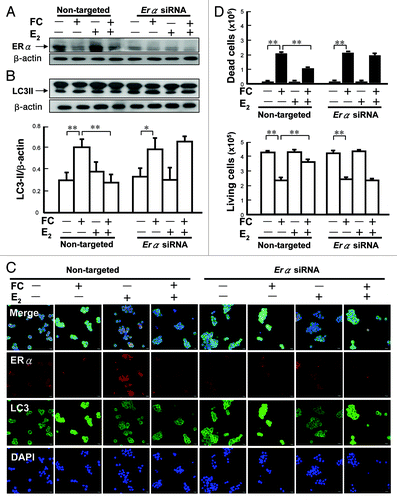
Figure 3. Involvement of ERα in the E2-mediated suppression of FC-induced autophagy in PC12 cells. (A) Erα RNA silencing decreased the levels of ERα. The differentiated PC12 cells were pre-treated with Erα siRNA (50 nM) for 24 h, followed by E2 treatment for an additional 24 h before FC exposure. (B) Erα RNA silencing diminished the suppression of FC-induced LC3 lipidation by E2. (C) Erα RNA silencing diminished the suppression of LC3 immunoreactivity by E2. In the nontargeted siRNA treated group, E2 suppressed the FC-induced LC3 immunoreactivity. (D) Erα silencing diminished the protective effect of E2 against FC-induced neurotoxicity. Data are expressed as means ± SD (n = 6), *p < 0.05, **p < 0.01.

Figure 3. Involvement of ERα in the E2-mediated suppression of FC-induced autophagy in PC12 cells. (A) Erα RNA silencing decreased the levels of ERα. The differentiated PC12 cells were pre-treated with Erα siRNA (50 nM) for 24 h, followed by E2 treatment for an additional 24 h before FC exposure. (B) Erα RNA silencing diminished the suppression of FC-induced LC3 lipidation by E2. (C) Erα RNA silencing diminished the suppression of LC3 immunoreactivity by E2. In the nontargeted siRNA treated group, E2 suppressed the FC-induced LC3 immunoreactivity. (D) Erα silencing diminished the protective effect of E2 against FC-induced neurotoxicity. Data are expressed as means ± SD (n = 6), *p < 0.05, **p < 0.01.

Figure 4. Sex differences in FC-induced autophagic signaling in the rat striatum. (A) FC increases more LC3 aggregation around the neuronal nucleus in male than in females. LC3 antibody followed by a secondary antibody conjugated with FITC and NeuN were used to stain LC3 aggregation (green) and neuronal nuclei (red), respectively. Nuclei were stained by DAPI. Arrows indicate LC3 aggregation around the NeuN positive nucleus. (B) FC-induces more autophagic cell death in male than in female rats. Rat striatum was stained using TUNEL and BECN1 for DNA damage (green) and autophagy (red), respectively. The merged views show round nuclei (yellow) depicting TUNEL(+) BECN1 immunoreactive cells with an intact nucleus, which is referred to as autophagic cell death and is indicated by arrows. (C) The basal level and level of FC-induced autophagy were lower in the CN of female than in male rats. (D) The level of FC-induced cleavage of spectrin was lower in the CN of female rats than it was in males. The levels of SBDP 145/150 in the CN of male and female rats with or without infusion of FC are shown as a ratio of SBDP 145/150/spectrin acting as an index of severity of injury. (E) The lesion ratio of FC-induced brain injury was lower in the CN of female rats than it was in males. The hemispheric area of the CN was quantified according to the density of the hematoxylin and eosin-stained tissue section by Image-pro plus software. The lesion ratio was estimated by dividing the hemispheric volume of the CN on the ipsilateral side by that on the contralateral side. (F) FC induces more severe behavioral deficit in male than in female rats. Forelimb use asymmetry ratio depicting an index of behavioral deficit. Data are expressed as means ± SD (n = 6), *p < 0.05, **p < 0.01.
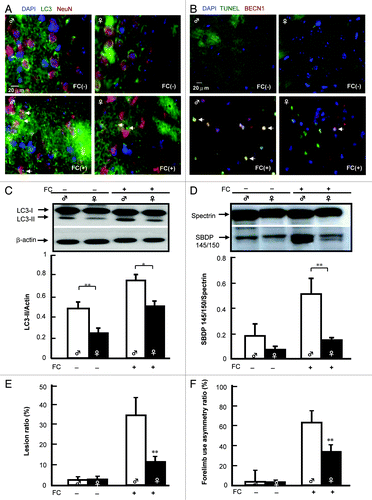
Figure 4. Sex differences in FC-induced autophagic signaling in the rat striatum. (A) FC increases more LC3 aggregation around the neuronal nucleus in male than in females. LC3 antibody followed by a secondary antibody conjugated with FITC and NeuN were used to stain LC3 aggregation (green) and neuronal nuclei (red), respectively. Nuclei were stained by DAPI. Arrows indicate LC3 aggregation around the NeuN positive nucleus. (B) FC-induces more autophagic cell death in male than in female rats. Rat striatum was stained using TUNEL and BECN1 for DNA damage (green) and autophagy (red), respectively. The merged views show round nuclei (yellow) depicting TUNEL(+) BECN1 immunoreactive cells with an intact nucleus, which is referred to as autophagic cell death and is indicated by arrows. (C) The basal level and level of FC-induced autophagy were lower in the CN of female than in male rats. (D) The level of FC-induced cleavage of spectrin was lower in the CN of female rats than it was in males. The levels of SBDP 145/150 in the CN of male and female rats with or without infusion of FC are shown as a ratio of SBDP 145/150/spectrin acting as an index of severity of injury. (E) The lesion ratio of FC-induced brain injury was lower in the CN of female rats than it was in males. The hemispheric area of the CN was quantified according to the density of the hematoxylin and eosin-stained tissue section by Image-pro plus software. The lesion ratio was estimated by dividing the hemispheric volume of the CN on the ipsilateral side by that on the contralateral side. (F) FC induces more severe behavioral deficit in male than in female rats. Forelimb use asymmetry ratio depicting an index of behavioral deficit. Data are expressed as means ± SD (n = 6), *p < 0.05, **p < 0.01.

Figure 5. Effect of E2 on FC-induced autophagy and injury in the CN of castrated rats. (A) The level of FC-induced autophagy was lower in the CN of ovariectomized females (♀ with a slash) than it was in castrated males (♂ with a slash), and E2 implantation significantly decreased the levels of FC-induced autophagy in ovariectomized females. (B) The severity of FC-induced injury was lower in the CN of female rats than it was in males and E2 implantation significantly decreased the ratios of SBDP 145/150/spectrin in both female and male castrated rats. Data are expressed as means ± SD (n = 6), *p < 0.05, **p < 0.01.
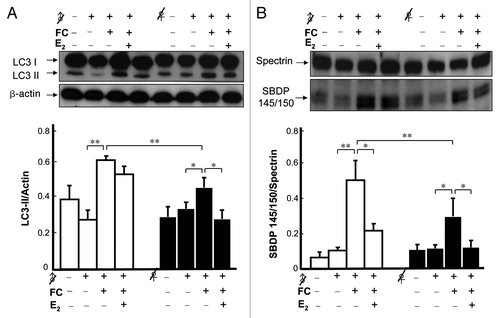
Figure 5. Effect of E2 on FC-induced autophagy and injury in the CN of castrated rats. (A) The level of FC-induced autophagy was lower in the CN of ovariectomized females (♀ with a slash) than it was in castrated males (♂ with a slash), and E2 implantation significantly decreased the levels of FC-induced autophagy in ovariectomized females. (B) The severity of FC-induced injury was lower in the CN of female rats than it was in males and E2 implantation significantly decreased the ratios of SBDP 145/150/spectrin in both female and male castrated rats. Data are expressed as means ± SD (n = 6), *p < 0.05, **p < 0.01.

Figure 6.Atg7 conditional knockout in DRD2 neurons abolished the sex difference in FC-induced CN injury. Knockout of Atg7 decreased the ATG7 immunoreactivity (A) and LC3 aggregation (B) in DRD2 neurons in both male and female mice. The brain tissues containing the CN from male or female mice with (Atg7+/–D rd2-Cre) or without (Atg7F/F) Atg7 conditional knockout were sampled 2 d after FC infusion and sectioned at 10 μm thickness. ATG7 antibody or LC3 antibody followed by a secondary antibody conjugated to FITC and DRD2 antibody followed by a second antibody conjugated to rhodamine were used to stain for ATG7 or LC3 (green) and DRD2 neurons (red), respectively. Simultaneously, nuclei were stained with DAPI. The nuclei surrounded by cytosolic ATG7 or LC3 in DRD2 neuron depict ATG7-containing or autophagic DRD2 neurons as indicated using arrows. (C) Knockout of Atg7 significantly decreased the FC-induced behavioral deficit in male mice and diminished the sex difference in FC-induced behavioral deficit. Forelimb use asymmetry ratio depicting an index of behavioral deficit. (D) Knockout of Atg7 significantly decreased the level of FC-induced striatal injury in male mice and diminished the sex difference in FC-induced striatal lesion ratio. Data are expressed as means ± SD (n = 6). *p < 0.05, **p < 0.01 compared with the sham control sex-matched group. ##p < 0.01 compared with the male sham.
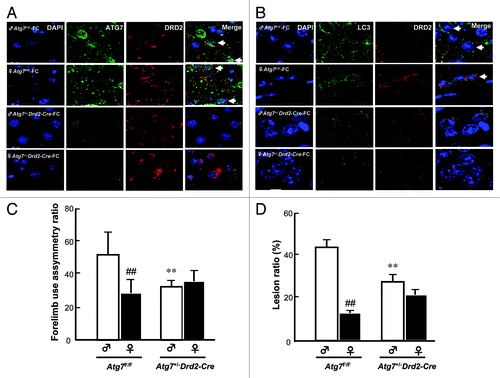
Figure 6.Atg7 conditional knockout in DRD2 neurons abolished the sex difference in FC-induced CN injury. Knockout of Atg7 decreased the ATG7 immunoreactivity (A) and LC3 aggregation (B) in DRD2 neurons in both male and female mice. The brain tissues containing the CN from male or female mice with (Atg7+/–D rd2-Cre) or without (Atg7F/F) Atg7 conditional knockout were sampled 2 d after FC infusion and sectioned at 10 μm thickness. ATG7 antibody or LC3 antibody followed by a secondary antibody conjugated to FITC and DRD2 antibody followed by a second antibody conjugated to rhodamine were used to stain for ATG7 or LC3 (green) and DRD2 neurons (red), respectively. Simultaneously, nuclei were stained with DAPI. The nuclei surrounded by cytosolic ATG7 or LC3 in DRD2 neuron depict ATG7-containing or autophagic DRD2 neurons as indicated using arrows. (C) Knockout of Atg7 significantly decreased the FC-induced behavioral deficit in male mice and diminished the sex difference in FC-induced behavioral deficit. Forelimb use asymmetry ratio depicting an index of behavioral deficit. (D) Knockout of Atg7 significantly decreased the level of FC-induced striatal injury in male mice and diminished the sex difference in FC-induced striatal lesion ratio. Data are expressed as means ± SD (n = 6). *p < 0.05, **p < 0.01 compared with the sham control sex-matched group. ##p < 0.01 compared with the male sham.

Reprints and Corporate Permissions

Please note: Selecting permissions does not provide access to the full text of the article, please see our help page How do I view content?

To request a reprint or corporate permissions for this article, please click on the relevant link below:

Academic Permissions

Please note: Selecting permissions does not provide access to the full text of the article, please see our help page How do I view content?

Obtain permissions instantly via Rightslink by clicking on the button below:

If you are unable to obtain permissions via Rightslink, please complete and submit this Permissions form. For more information, please visit our Permissions help page.