2,591
Views
87
CrossRef citations to date
0
Altmetric
Basic Research Paper

Autophagy restricts Chlamydia trachomatis growth in human macrophages via IFNG-inducible guanylate binding proteins

, , , &
Pages 50-62 | Received 30 Apr 2012, Accepted 08 Oct 2012, Published online: 19 Oct 2012

Figures & data

Figure 1. IFNG inhibited C. trachomatis growth in human macrophages. THP1 macrophages were treated with 100 U/ml IFNG prior to infection, then infected for 48 h with C. trachomatis (MOI 5) and simultaneously treated with 100 U/ml IFNG or left untreated (control). (A) Immunofluorescence micrographs of macrophages infected with C. trachomatis (green) and DNA (blue). Cytokine treatment resulted in a low number of detectable inclusions in C. trachomatis infected cells. Images are representative of at least three independent experiments (B) Influence of IFNG on development of infectious progeny. The yield of C. trachomatis infectious progeny decreased by 50% upon IFNG stimulation. Infectivity percentages were calculated following infection of HeLa cells: IFU/ml estimated for each treated monolayer / IFU/ml of control cells x 100. Infectivity expressed as a percentage of control cells ± standard deviation (SD) from three independent experiments (n = 3). Ctr, C. trachomatis. Scale bars: 30 μm.
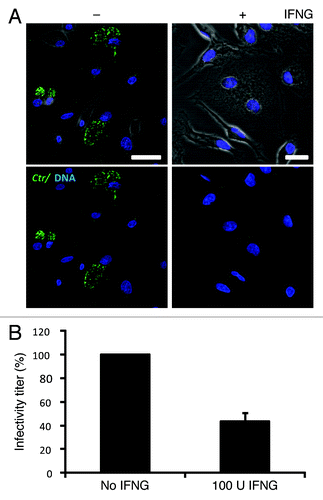
Figure 1. IFNG inhibited C. trachomatis growth in human macrophages. THP1 macrophages were treated with 100 U/ml IFNG prior to infection, then infected for 48 h with C. trachomatis (MOI 5) and simultaneously treated with 100 U/ml IFNG or left untreated (control). (A) Immunofluorescence micrographs of macrophages infected with C. trachomatis (green) and DNA (blue). Cytokine treatment resulted in a low number of detectable inclusions in C. trachomatis infected cells. Images are representative of at least three independent experiments (B) Influence of IFNG on development of infectious progeny. The yield of C. trachomatis infectious progeny decreased by 50% upon IFNG stimulation. Infectivity percentages were calculated following infection of HeLa cells: IFU/ml estimated for each treated monolayer / IFU/ml of control cells x 100. Infectivity expressed as a percentage of control cells ± standard deviation (SD) from three independent experiments (n = 3). Ctr, C. trachomatis. Scale bars: 30 μm.

Figure 2. Early interactions of hGBP1 and GBP2 with chlamydial inclusions mediated IFNG-induced C. trachomatis growth inhibition. (A) Anti-hGBP1 and -GBP2 immunoblot analysis of total lysates from uninfected macrophages, and uninfected macrophages exposed to 100 U/ml IFNG for 24 h. Other monolayers were pretreated with IFNG for 24 h prior to infection and then infected in the presence of IFNG. Host ACTB was used as loading control. (A) hGBP1/2 expression is induced by IFNG, while infection alone had minimal stimulatory effect on hGBP2 expression. Only very low amounts of cellular hGBP2 can be detected in control cells, compared with treated cells. Blot is representative of two independent experiments (B) Double immunofluorescence labeling of hGBP1, hGBP2 and C. trachomatis in macrophages stimulated for 24 h with 100 U/ml IFNG and then infected for 2 h with C. trachomatis (MOI 50). IFNG untreated cells were similarly infected. Upon IFNG induction hGBP1/2 localized to inclusions. For quantification, approximately 100 cells were examined for hGBP1/2-C. trachomatis colocalization in cytokine-treated or untreated cells. Colocalization calculated as a mean percentage: for each treatment, number of hGBP1/2 positive inclusions/total number of inclusions × 100 from two independent experiments (C and D) Deletion of either hGBP1, hGBP2 or both promotes intracellular growth of the bacterial inclusion. Unstimulated and IFNG-stimulated THP1-derived macrophages were infected with C. trachomatis for 48 h (MOI 5). IFNG stimulation did not inhibit chlamydial growth in hGBP1, hGBP2 or double knockdown deficient cells compared with THP1- and control (empty)-derived macrophages. (C) Analysis of inclusion numbers in cells infected (MOI 5) for 48 h was performed by counting inclusions in 100 cells. (D) Infectivity of bacteria in hGBP1 or hGBP2 deficient cells, as well as double knockdown cells is 2-fold higher than in control (empty)- or THP1-derived macrophages. Results depicted as mean percentage normalized to control. Results shown in (C and D) are from three independent experiments. Error bars ± SD. Statistical significance was analyzed by Student’s t-test; *p < 0.01. Scale bars: 10 μm.
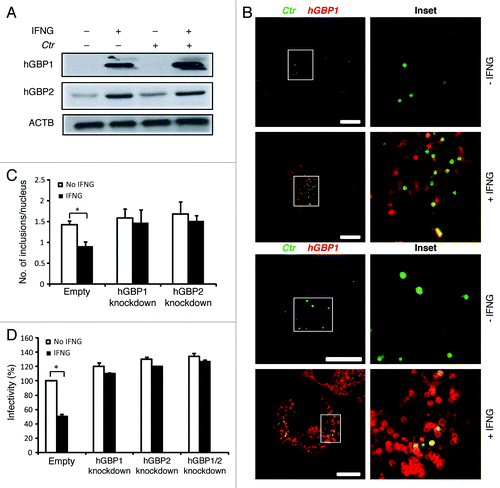
Figure 2. Early interactions of hGBP1 and GBP2 with chlamydial inclusions mediated IFNG-induced C. trachomatis growth inhibition. (A) Anti-hGBP1 and -GBP2 immunoblot analysis of total lysates from uninfected macrophages, and uninfected macrophages exposed to 100 U/ml IFNG for 24 h. Other monolayers were pretreated with IFNG for 24 h prior to infection and then infected in the presence of IFNG. Host ACTB was used as loading control. (A) hGBP1/2 expression is induced by IFNG, while infection alone had minimal stimulatory effect on hGBP2 expression. Only very low amounts of cellular hGBP2 can be detected in control cells, compared with treated cells. Blot is representative of two independent experiments (B) Double immunofluorescence labeling of hGBP1, hGBP2 and C. trachomatis in macrophages stimulated for 24 h with 100 U/ml IFNG and then infected for 2 h with C. trachomatis (MOI 50). IFNG untreated cells were similarly infected. Upon IFNG induction hGBP1/2 localized to inclusions. For quantification, approximately 100 cells were examined for hGBP1/2-C. trachomatis colocalization in cytokine-treated or untreated cells. Colocalization calculated as a mean percentage: for each treatment, number of hGBP1/2 positive inclusions/total number of inclusions × 100 from two independent experiments (C and D) Deletion of either hGBP1, hGBP2 or both promotes intracellular growth of the bacterial inclusion. Unstimulated and IFNG-stimulated THP1-derived macrophages were infected with C. trachomatis for 48 h (MOI 5). IFNG stimulation did not inhibit chlamydial growth in hGBP1, hGBP2 or double knockdown deficient cells compared with THP1- and control (empty)-derived macrophages. (C) Analysis of inclusion numbers in cells infected (MOI 5) for 48 h was performed by counting inclusions in 100 cells. (D) Infectivity of bacteria in hGBP1 or hGBP2 deficient cells, as well as double knockdown cells is 2-fold higher than in control (empty)- or THP1-derived macrophages. Results depicted as mean percentage normalized to control. Results shown in (C and D) are from three independent experiments. Error bars ± SD. Statistical significance was analyzed by Student’s t-test; *p < 0.01. Scale bars: 10 μm.

Figure 3. IFNG-induced lysosomal interaction with early chlamydial inclusions was abrogated in hGBP1 and hGBP2 knockdown macrophages. (A) Empty (control), hGBP1 and hGBP2-stable knockdown THP1-derived macrophage monolayers were prestimulated for 24 h with 100 U/ml IFNG and then infected with C. trachomatis as described in . IFNG untreated control cells were similarly infected. (A) Double immunofluorescence labeling 3 h p.i. revealed that IFNG stimulated the association of the lysosomal marker LAMP1 (red) with C. trachomatis (blue) inclusions in control cells. While IFNG stimulation demonstrated no recruitment of lysosomes to inclusions in cells deficient of either hGBP1 or hGBP2. Images are representative of two independent experiments. (B) Percentage colocalization Ctr inclusions with LAMP1. Quantification of LAMP1-positive chlamydial inclusions revealed nonsignificant colocalization in cells lacking hGBP1 or hGBP2. Approximately 100 cells per sample were examined. Colocalization expressed as a mean percentage: for each treatment, number of LAMP1 inclusions / total number of inclusions × 100. (C) Inhibition of lysosomal acidification by 100 nM BafA1 abrogated the IFNG-mediated inhibition of C. trachomatis inclusion growth. Infectivity assays were performed as in . BafA1 led to an increase in the yield of infectious progeny in IFNG-treated cells Results shown in (B and C) are from three independent experiments. Error bars ± SD. Statistical significance was analyzed by Student’s t-test; **p < 0.01, *p < 0.05. Scale bars: 5 μm.
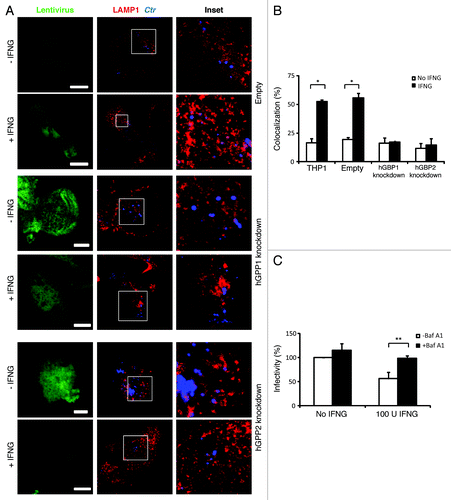
Figure 3. IFNG-induced lysosomal interaction with early chlamydial inclusions was abrogated in hGBP1 and hGBP2 knockdown macrophages. (A) Empty (control), hGBP1 and hGBP2-stable knockdown THP1-derived macrophage monolayers were prestimulated for 24 h with 100 U/ml IFNG and then infected with C. trachomatis as described in Figure 2. IFNG untreated control cells were similarly infected. (A) Double immunofluorescence labeling 3 h p.i. revealed that IFNG stimulated the association of the lysosomal marker LAMP1 (red) with C. trachomatis (blue) inclusions in control cells. While IFNG stimulation demonstrated no recruitment of lysosomes to inclusions in cells deficient of either hGBP1 or hGBP2. Images are representative of two independent experiments. (B) Percentage colocalization Ctr inclusions with LAMP1. Quantification of LAMP1-positive chlamydial inclusions revealed nonsignificant colocalization in cells lacking hGBP1 or hGBP2. Approximately 100 cells per sample were examined. Colocalization expressed as a mean percentage: for each treatment, number of LAMP1 inclusions / total number of inclusions × 100. (C) Inhibition of lysosomal acidification by 100 nM BafA1 abrogated the IFNG-mediated inhibition of C. trachomatis inclusion growth. Infectivity assays were performed as in Figure 1B. BafA1 led to an increase in the yield of infectious progeny in IFNG-treated cells Results shown in (B and C) are from three independent experiments. Error bars ± SD. Statistical significance was analyzed by Student’s t-test; **p < 0.01, *p < 0.05. Scale bars: 5 μm.

Figure 4. IFNG stimulation increased acidification of chlamydial early inclusions, but not in hGBP1 or -2 knockdown macrophages. Empty (control), hGBP1 and hGBP2-stable knockdown THP1-derived macrophage monolayers were prestimulated for 24 h with 100 U/ml IFNG and then infected with C. trachomatis MOI 100 for 2 h. Confocal microscopy images of acidotropic dye LysoTracker (Red) and C. trachomatis (Blue) revealed that IFNG stimulated the acidification of chlamydial early inclusions in WT macrophages. By contrast, the acidification process is impaired in cells deficient in either hGBP1 or 2, in response to IFNG stimulation. Scale bars: 10 μm.
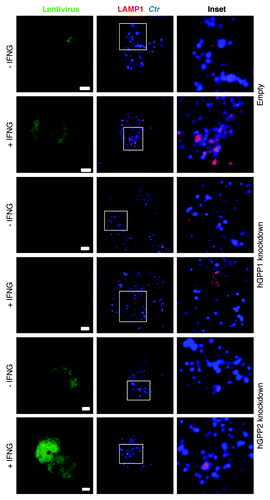
Figure 4. IFNG stimulation increased acidification of chlamydial early inclusions, but not in hGBP1 or -2 knockdown macrophages. Empty (control), hGBP1 and hGBP2-stable knockdown THP1-derived macrophage monolayers were prestimulated for 24 h with 100 U/ml IFNG and then infected with C. trachomatis MOI 100 for 2 h. Confocal microscopy images of acidotropic dye LysoTracker (Red) and C. trachomatis (Blue) revealed that IFNG stimulated the acidification of chlamydial early inclusions in WT macrophages. By contrast, the acidification process is impaired in cells deficient in either hGBP1 or 2, in response to IFNG stimulation. Scale bars: 10 μm.

Figure 5. Autophagy-induced chlamydial growth arrest in response to IFNG stimulation was abrogated in cells with impaired autophagy. IFNG induces localization of autophagosomes to inclusions. Macrophages were exposed to 100 U/ml IFNG for 24 h. Cells were then infected with C. trachomatis (MOI 100) for 3 h. IFNG-untreated control cells were similarly infected. LC3 (red) localized to bacterial inclusions (green) in response to IFNG stimulation (A). (B) Quantification of LC3-positive C. trachomatis inclusions in the presence or absence of IFNG. Approximately 30 host cells were examined for LC3- C. trachomatis sequestration per sample. Quantification results shown as mean percentage normalized to control from two independent experiments. Error bars ± SD (C) Anti-LC3 immunoblot analysis of total lysates from uninfected and chlamydia infected macrophages; in the presence or absence of IFNG pre-treatment for 24 h. Host ACTB was used to control equal loading of proteins. Autophagy is induced by IFNG treatment and to a lesser extent after chlamydial infection, as indicated by the amount of LC3-II. IFNG treatment activated autophagic flux as indicated by reduced levels of SQSTM1. Blot is representative of two independent experiments. (D) Normal development of chlamydia in cells with impaired autophagy. ATG5 stable knockdown cells or control (empty) cells were IFNG treated and infected, as in . Infectivity of bacteria from macrophages lacking ATG5 was 2-fold higher than that in control cells. Further, IFNG treatment had minimal activity against bacteria in cells with impaired autophagy. Infectivity expressed as a ratio between infected IFNG-treated and infected-untreated cells from three independent experiments. (E) Influence of ectopic overexpression of hGBP1 on development of infectious progeny in cells lacking ATG5. Infectivity of bacteria in ATG5 deficient cells or ATG5 KD-overexpressing hGBP1 cells is comparable. Results depicted as mean percentage normalized to control. Error bars ± SD. Scale bars: 10 μm.
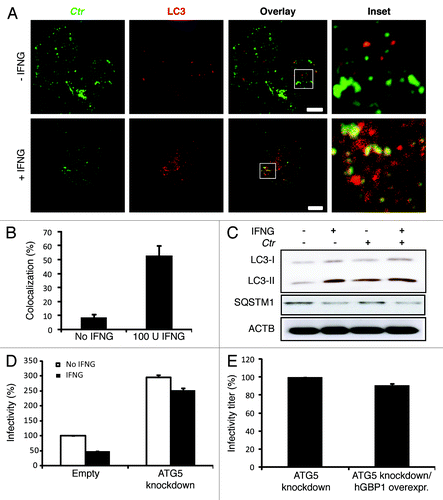
Figure 5. Autophagy-induced chlamydial growth arrest in response to IFNG stimulation was abrogated in cells with impaired autophagy. IFNG induces localization of autophagosomes to inclusions. Macrophages were exposed to 100 U/ml IFNG for 24 h. Cells were then infected with C. trachomatis (MOI 100) for 3 h. IFNG-untreated control cells were similarly infected. LC3 (red) localized to bacterial inclusions (green) in response to IFNG stimulation (A). (B) Quantification of LC3-positive C. trachomatis inclusions in the presence or absence of IFNG. Approximately 30 host cells were examined for LC3- C. trachomatis sequestration per sample. Quantification results shown as mean percentage normalized to control from two independent experiments. Error bars ± SD (C) Anti-LC3 immunoblot analysis of total lysates from uninfected and chlamydia infected macrophages; in the presence or absence of IFNG pre-treatment for 24 h. Host ACTB was used to control equal loading of proteins. Autophagy is induced by IFNG treatment and to a lesser extent after chlamydial infection, as indicated by the amount of LC3-II. IFNG treatment activated autophagic flux as indicated by reduced levels of SQSTM1. Blot is representative of two independent experiments. (D) Normal development of chlamydia in cells with impaired autophagy. ATG5 stable knockdown cells or control (empty) cells were IFNG treated and infected, as in Figure 1. Infectivity of bacteria from macrophages lacking ATG5 was 2-fold higher than that in control cells. Further, IFNG treatment had minimal activity against bacteria in cells with impaired autophagy. Infectivity expressed as a ratio between infected IFNG-treated and infected-untreated cells from three independent experiments. (E) Influence of ectopic overexpression of hGBP1 on development of infectious progeny in cells lacking ATG5. Infectivity of bacteria in ATG5 deficient cells or ATG5 KD-overexpressing hGBP1 cells is comparable. Results depicted as mean percentage normalized to control. Error bars ± SD. Scale bars: 10 μm.

Figure 6. IFNG treatment induced rerouting of chlamydial early inclusions to autophagosomes. Transmission electron microscopy displays ultrastructural features of early C. trachomatis inclusions in infected THP1-derived macrophages. Host cells were exposed to medium containing 100 U/ml IFNG for 24 h or left untreated as a control. (A) Micrograph of infected untreated host cells shows normal chlamydial EBs (arrows) within the early inclusion. (B and C) Micrograph of infected cells exposed to IFNG demonstrates the presence of one EB (early inclusion) surrounded by a double membrane (B) or vesicles surrounding a morphologically abnormal chlamydial early inclusion (arrow) (C).
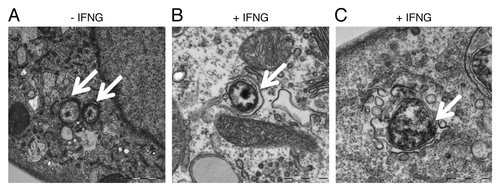
Figure 6. IFNG treatment induced rerouting of chlamydial early inclusions to autophagosomes. Transmission electron microscopy displays ultrastructural features of early C. trachomatis inclusions in infected THP1-derived macrophages. Host cells were exposed to medium containing 100 U/ml IFNG for 24 h or left untreated as a control. (A) Micrograph of infected untreated host cells shows normal chlamydial EBs (arrows) within the early inclusion. (B and C) Micrograph of infected cells exposed to IFNG demonstrates the presence of one EB (early inclusion) surrounded by a double membrane (B) or vesicles surrounding a morphologically abnormal chlamydial early inclusion (arrow) (C).

Figure 7. hGBP1 and hGBP2 played a role in the regulation of the host autophagic machinery. (A–C) Anti-LC3 and SQSTM1 immunoblot analysis of total lysates from uninfected control (empty), hGBP1- and hGBP2-stable knockdown macrophages or from cultures infected for the indicated time points in the presence or absence of 100 U/ml IFNG for 24 h. Other monolayers were pretreated with IFNG for 24 h prior to infection and then infected in the presence of IFNG. Host ACTB was used as loading control. IFNG induced autophagy in control THP1-derived macrophages; similarly treated cells infected with C. trachomatis induced autophagy as indicated by the higher amount of LC3II and reduced amount of SQSTM1. (B and C) hGBP1 or hGBP2 knockdown impaired autophagy induction. Only very low amounts of cellular LC3II, but increasing amounts of SQSTM1 can be detected in hGBP2-knockdown cells, compared with those in control THP1-derived macrophages, while hGBP1 knockdown had a minimal stimulatory effect on autophagy. (D) Anti-ATG5 and ATG12 immunoblots of total lysates from control (empty), hGBP1- and hGBP2-stable knockdown macrophages. Monolayers were pretreated with IFNG for 24 h prior to infection and then infected with C. trachomatis (MOI 10) in the presence of IFNG or left without treatment. Host ACTB was used as loading control. IFNG induced ATG12–ATG5 conjugate formation in all cells. hGBP2, and to a lesser extent hGBP1, knockdown impaired autophagy induction. Monomeric ATG5 and ATG12 were detected in cells lacking hGBP2, and to lesser extents in cells lacking hGBP1, but were absent in control THP1-derived macrophages. Blot shown in (A) is representative of three independent experiments and blots in (B–D) are representatives from two independent experiments.
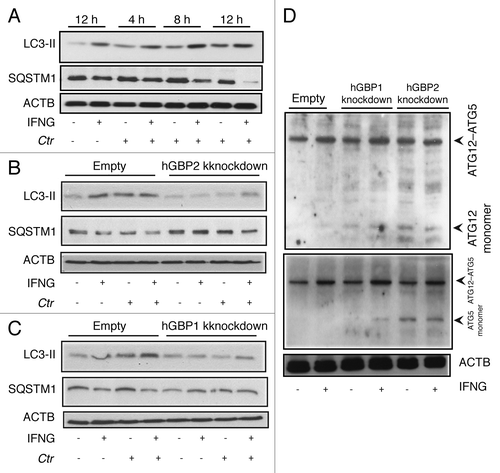
Figure 7. hGBP1 and hGBP2 played a role in the regulation of the host autophagic machinery. (A–C) Anti-LC3 and SQSTM1 immunoblot analysis of total lysates from uninfected control (empty), hGBP1- and hGBP2-stable knockdown macrophages or from cultures infected for the indicated time points in the presence or absence of 100 U/ml IFNG for 24 h. Other monolayers were pretreated with IFNG for 24 h prior to infection and then infected in the presence of IFNG. Host ACTB was used as loading control. IFNG induced autophagy in control THP1-derived macrophages; similarly treated cells infected with C. trachomatis induced autophagy as indicated by the higher amount of LC3II and reduced amount of SQSTM1. (B and C) hGBP1 or hGBP2 knockdown impaired autophagy induction. Only very low amounts of cellular LC3II, but increasing amounts of SQSTM1 can be detected in hGBP2-knockdown cells, compared with those in control THP1-derived macrophages, while hGBP1 knockdown had a minimal stimulatory effect on autophagy. (D) Anti-ATG5 and ATG12 immunoblots of total lysates from control (empty), hGBP1- and hGBP2-stable knockdown macrophages. Monolayers were pretreated with IFNG for 24 h prior to infection and then infected with C. trachomatis (MOI 10) in the presence of IFNG or left without treatment. Host ACTB was used as loading control. IFNG induced ATG12–ATG5 conjugate formation in all cells. hGBP2, and to a lesser extent hGBP1, knockdown impaired autophagy induction. Monomeric ATG5 and ATG12 were detected in cells lacking hGBP2, and to lesser extents in cells lacking hGBP1, but were absent in control THP1-derived macrophages. Blot shown in (A) is representative of three independent experiments and blots in (B–D) are representatives from two independent experiments.
Supplemental material

Additional material

Download Zip (3.5 MB)

Reprints and Corporate Permissions

Please note: Selecting permissions does not provide access to the full text of the article, please see our help page How do I view content?

To request a reprint or corporate permissions for this article, please click on the relevant link below:

Academic Permissions

Please note: Selecting permissions does not provide access to the full text of the article, please see our help page How do I view content?

Obtain permissions instantly via Rightslink by clicking on the button below:

If you are unable to obtain permissions via Rightslink, please complete and submit this Permissions form. For more information, please visit our Permissions help page.