Figures & data
Figure 1. Experimental design for measuring autophagic vesicle dynamics using EGFP-LC3. (A) EGFP-LC3 vesicles were imaged in U2OS cells by fluorescent microscopy and subjected to an image processing protocol including deconvolution, intensity thresholding and object quantification (see Materials and Methods for details). Example cell shown was cropped from a 60×-captured image. The red boundary defines the cellular region-of-interest. EGFP-positive puncta above the intensity threshold are highlighted in cyan. Insets are 2× magnifications of boxed regions. (B) Simplified model of lysosomal inhibition. Cells treated with vehicle control (−BafA1) have active lysosomes and EGFP-LC3 vesicles are continually synthesized and cleared by lysosomal fusion (fluorescence quenched). Bafilomycin A1 (BafA1) treatment inhibits lysosome function (indicated with red inhibitory symbols) and thereby causes accumulation of EGFP-LC3 vesicles, which are protected from lysosome-mediated fluorescent quenching. Green-filled circles represent EGFP-LC3-positive AVs, whereas white-filled circles represent AVs that have fused with a lysosome (L). (C) Snapshots from areas imaged within single cells treated with vehicle (left panels; −BafA1) or BafA1 (right panels; +BafA1) for 0 min, 24 min or 48 min. Images are from deconvolved 60×-captured images.
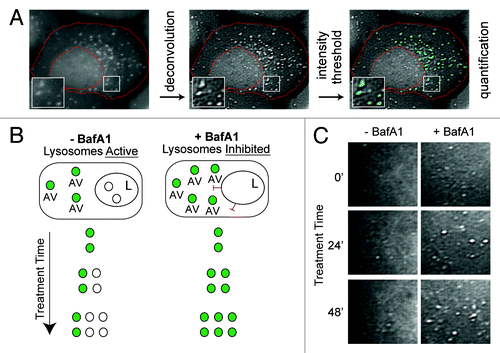
Figure 2. Single-cell counts of EGFP-positive puncta under conditions of basal and induced autophagy. (A) Basal autophagy reflected EGFP-LC3 vesicle dynamics in full nutrient medium. Following a 21 min pre-incubation period with vehicle (−BafA1; top panels) or BafA1 (+BafA1; bottom panels), U2OS-EGFP-LC3 cells were treated with DMSO control at time t = 0 and 46 images were captured at 1.5 min intervals. Along with addition of DMSO, media was replaced with fresh media containing or lacking BafA1 at time t = 0. Images of several cells are shown at time t = 0 min and at time t = 60 min. Insets are 2× magnifications of boxed regions. (B) Population-averaged basal AV dynamics. The number of EGFP-LC3 vesicles that accumulated in the presence (black circles) or absence (gray circles) of BafA1 was plotted from time t = 0 through t = 70 min. Values on the vertical axis represent mean numbers of vesicles with adjustment such that the value at t = 0 is 0. Means were adjusted by subtracting the mean number of vesicles at t = 0. Means were calculated on the basis of measurements from all cells across three independent experiments (−BafA1: n = 51 cells at each time point; +BafA1: n = 44 cells at each time point). Bars represent standard deviations. (C) Induced autophagy reflected EGFP-LC3 vesicle dynamics in full nutrient medium supplemented with 100 nM AZD8055 at time t = 0. Cells were pretreated with vehicle or BafA1 as described above. (D) Population-averaged induced AV dynamics. The experiments and quantitative measurements of (A and B) were repeated but with the addition of 100 nM AZD8055 at time t = 0. Mean values were determined using measurements from all cells imaged across three independent experiments (–BafA1: n = 70 cells at each time point; +BafA1: n = 51 cells at each time point). As in (B), the mean AV count per cell at t = 0 was subtracted from the mean determined at each time point. (E) U2OS cells were treated with AZD8055 (5 nM and 100 nM) or vehicle (DMSO) control for 1 h in the presence (+) or absence (−) of BafA1 (following a 30 min pretreatment with or without BafA1) and whole cell lysates probed by immunoblotting for total RPS6, phospho-RPS6 (S235/6) and LC3B.
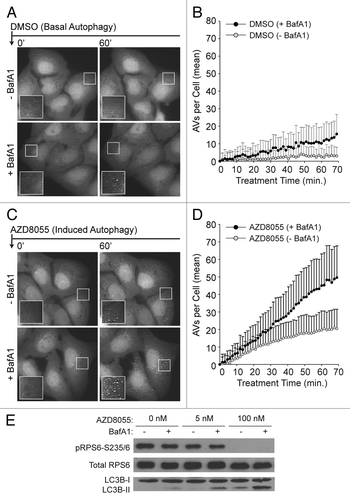
Figure 3. Model-based analysis of basal and induced autophagy dynamics. (A) A population dynamics model was formulated that captures the processes illustrated here: production of AVs (from membrane sources) at a constant rate P, increased production at a constant rate (1 + k)P in the presence of an MTOR (and thereby, TORC1) inhibitor, clearance of AVs (into a pool of lysosomes, the sink, where they fuse and deliver cargo) in a first-order process with rate constant c, and complete inhibition of clearance in the presence of BafA1. Presence (absence) of an MTOR inhibitor (e.g., AZD8055) is signified by δa = 1 (0). Likewise, presence (absence) of BafA1 is signified by δb = 1(0). Analytical expressions for V(t), which represents the average number of AVs per cell as a function of time t, are given in Materials and Methods. (B and C) Values of model parameters (P, c and k) and the initial condition V(0) = V0 were estimated through nonlinear least squares fitting; the goodness of fit is illustrated in these panels. Fits are based on the data of . The gray circles in (B and C) represent the adjusted mean AV counts reported earlier in (basal autophagy, δa = 0) and (AZD8055-induced autophagy, δa = 1). In (B and C), time courses produced by the model with best-fit parameter values (p = 0.18 min−1, c = 0.037 min−1 and k = 2.9) and V0 = 0, the best-fit initial condition, are shown for δb = 1 (+BafA1; red curves) and δb = 0 (−BafA1; blue curves).
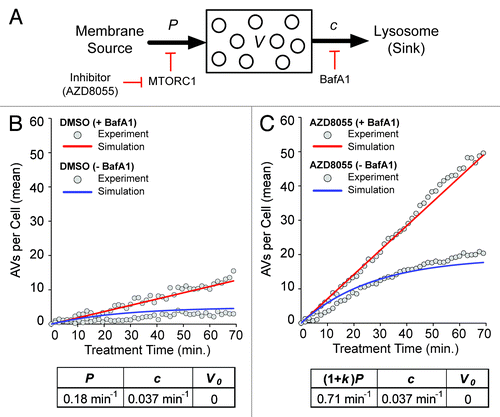
Figure 4. Induced autophagy dynamics are similar for different MTOR inhibitors. (A) Following a 21 min pre-incubation period with vehicle (−BafA1; top panels) or BafA1 (+BafA1; bottom panels), U2OS-EGFP-LC3 cells were treated with 100 nM rapamycin and 46 images were captured at 1.5 min intervals in media containing or lacking BafA1. Images of several cells are shown at time t = 0 min and at time t = 60 min. Insets are 2× magnifications of boxed regions. (B) The number of EGFP-LC3 vesicles in the presence (black circles) or absence (gray circles) of BafA1 was plotted as a function of time after rapamycin treatment. Rapamycin was added at t = 0. Values represent the mean number of vesicles minus the mean number of vesicles at time t = 0, with averages taken over all cells imaged at each time point across three independent experiments (−BafA1: n = 52 cells at each time point; +BafA1: n = 69 cells at each time point). Bars indicate standard deviations. (C) The population dynamics model reproduced the rapamycin data. Red and blue curves represent model-derived time courses for conditions with and without BafA1, respectively. Gray circles represent the adjusted experimental averages shown in (B). Best-fit values of (1 + k)P, c, V0 are as indicated.
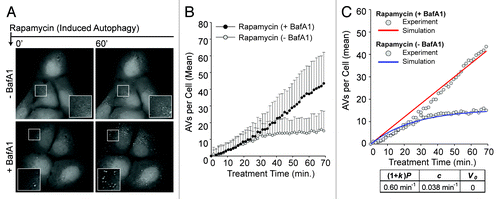
Figure 5. Overview of key molecules included in the mechanistic stochastic model of autophagic vesicle dynamics. (A) Molecules and reactions included in this model are illustrated using the conventions of Systems Biology Graphical Notation (SBGN). Compartments are indicated by dashed lines. Chemical species are represented by rounded rectangles. Arrows represent interactions as indicated in the legend on the right. Reactions considered in the model are listed in Equations 1–23. (B) Reaction nomenclature. For our model, the reactions that take place in a given cell at a given time t are partitioned into n(t) + 1 sets, where n(t) is the number of PGs and mature AVs present in the cell at time t. Recall that we consider 23 different reactions (Eqns. 1–23). Sixteen of these reactions involve chemical species in the membrane-of-origin compartment (Eqns. 1–16), i.e., the compartment from which all PGs and mature AVs emerge. The other seven reactions (Eqns. 17–23) are associated with specific PGs or AVs, and as a result, there are n(t) instances of each reaction described by Equations 17–23. For example, in our model, each PG is allowed to mature into an AV (Eqn. 20), and each mature AV is allowed to fuse with a lysosome (Eqn. 23). Thus, the total number of reactions in a cell at time t, including multiple instances of reactions, is 16 + 7n(t). We label all n(t) maturing and mature vesicles present in a cell at time t as follows: V1, V2…, Vn. The reactions specific to vesicle k are labeled Rk,17, Rk,18, Rk,19, Rk,20, Rk,21, Rk,22 and Rk,23. The reactions involving chemical species in the membrane-of-origin are labeled R1, R2,…, R16.
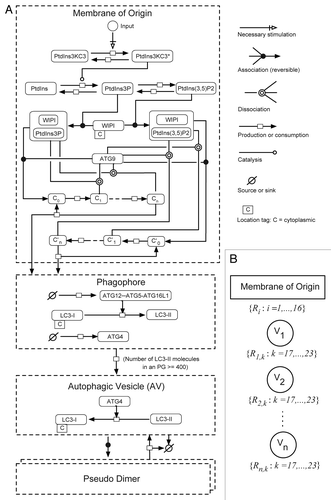
Table 1. Mechanistic model parameter values for a cell volume assumed to be 3 × 10⁻¹² L
Figure 6. The stochastic mechanistic model is consistent with population-averaged AV counts as well as single-cell trajectories. As discussed in the text, the values of selected parameters were varied systematically to find values that allow the model to reproduce the population-averaged data of (gray circles in ). Other parameter values were estimated as described in Model Parameters. The quality of fit obtained is illustrated in (A and B) for basal autophagy dynamics and AZD8055-induced autophagy dynamics, respectively. In these panels, solid curves are based on averages from 100 stochastic simulation runs. Red and blue curves correspond to +BafA1 and −BafA1 conditions, in these panels as well as in (C–F). For details about the simulation method, see Materials and Methods. For standard deviations of averaged simulation results, see Figure S4. In (C–F), it can be seen that single stochastic traces produced by simulation of the model (solid curves) resemble experimentally determined time courses (circles). An experimental time course and a corresponding simulation are shown for each of the following conditions: (C) DMSO (basal autophagy) −BafA1, (D) DMSO (basal autophagy) +BafA1, (E) AZD8055 (induced autophagy) −BafA1 and (F) AZD8055 (induced autophagy) +BafA1. To allow comparison of the simulated and experimental curves despite minor variations in initial vesicle counts observed experimentally, we adjusted experimental values using the following offsets (values were added to the experimental counts): 4.25 (DMSO – BafA1), 3.5 (DMSO + BafA1), 1.0 (AZD8055 – BafA1), 1.0 (AZD8055 + BafA1). The experimental and simulation results shown in (C–F) were chosen to demonstrate that single simulation runs (solid curves) resemble data from time-lapse microscopy experiments (gray circles).
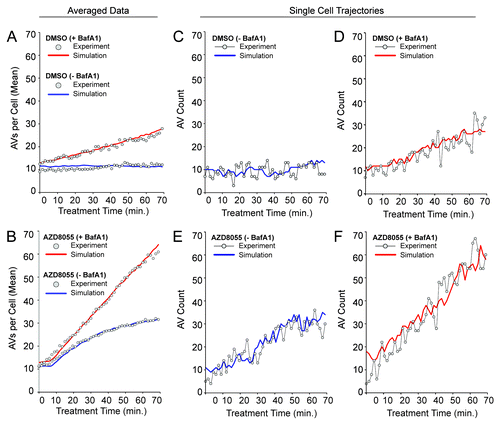
Figure 7. The mechanistic model is consistent with a greater abundance of closed vesicles than phagophores. (A–D) Trajectories generated from the tuned model are depicted for treatment periods with DMSO control (A and B; basal autophagy) or AZD8055 (C and D; induced autophagy) in the presence (+BafA1; A and C) or absence (−BafA1; B and D) of BafA1. In plots (A–D), vesicle counts per cell were not adjusted to 0 at t = 0, as in , to accommodate visualization of the low PG counts. Fluctuations were observed in the experimental data and this presumed extrinsic noise was accounted for by including pseudo dimers in the model (see Eqn. 22). Inclusion of pseudo dimers in the model was intended to account for vesicle aggregates being miscounted as a single vesicle or vesicles disappearing from the focal plane. Predicted true total vesicle counts are indicated by magenta curves (“All Vesicles”) and predicted visible vesicle counts are indicated by black curves. Cyan curves represent predicted counts of phagophores (PGs). (E) Wild-type U2OS cells were immunostained for endogenous ATG12, a marker of PGs. Immunostaining indicates that PGs were less abundant than free AVs. AF488-conjugated secondary antibodies were used to detect primary ATG12 staining and image captured at 100×. Inset represents a 2× magnification of the boxed region.
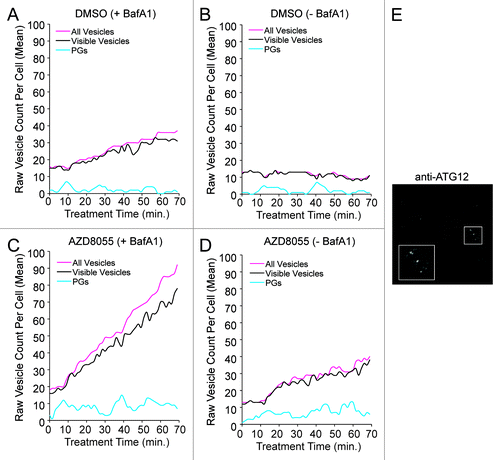
Figure 8. Experimental data supported the predicted effects of ATG9 depletion. (A) Model-predicted effects of 80% ATG9 depletion (solid curves) under DMSO conditions +BafA1 (red curve) or −BafA1 (blue curve). Basal autophagy control simulations (averaged results from 100 single stochastic simulations) are shown as broken curves, +BafA1 (red curve) or −BafA1 (blue curve), for comparison. (B and C) Approximately 40 h prior to imaging and quantification, U2OS-EGFP-LC3 cells were transfected with siRNAs targeting ATG9. (B) Relative ATG9A expression (mRNA) was measured by qRT-PCR (relative to GAPDH; normalized to control siRNA). Bars represent standard deviations. (C) Following a 21 min preincubation period with media containing (bottom panels) or lacking (top panels) BafA1, cells were imaged 46 times at 1.5 min intervals in full-nutrient media in the presence or absence of BafA1. Images of several cells at each 0 min and 60 min are shown. Insets are 2× magnifications of boxed regions. (D) Total EGFP-LC3 vesicles accumulating during ATG9 knockdown +BafA1 (black circles) or −BafA1 (gray circles) are plotted across time. Values represent the mean vesicles accumulating (normalized to 0 at time 0 min) from all cells measured across 3 independent experiments (−BafA1: n = 36 cells per time point; +BafA1: n = 34 cells per time point). Bars represent standard deviations. The red and blue curves represent the mechanistic model simulations from (A) for ATG9 knockdown with and without BafA1, respectively. To allow comparison of the simulated and experimental curves despite minor variations in initial vesicle counts observed experimentally, we adjusted experimental values using the following offsets (values were added to the experimental counts): 0.75 (ATG9 siRNA – BafA1), 1.25 (ATG9 siRNA +BafA1).
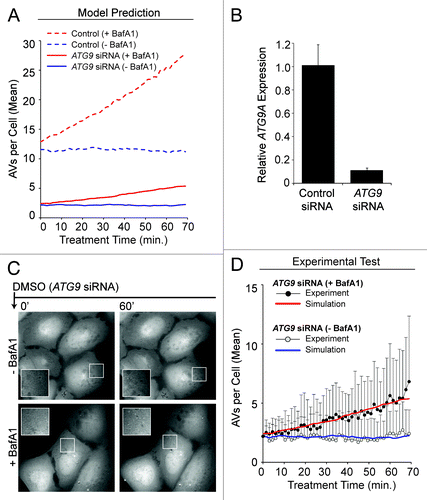
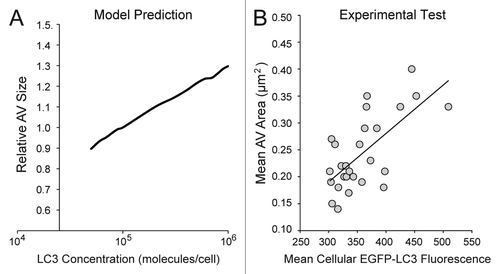
Figure 9. The model predicted a positive correlation between cellular LC3 concentration and autophagic vesicle size. (A) The model was used to generate predictions for a range of relative LC3 concentrations (normalized to the value used in the model, 100,000 molecules/cell) and resulting outputs of relative autophagic vesicle size. In this analysis, we assumed that the size of a vesicle was proportional to X. Simulation results were reported after 90 min treatment with DMSO + BafA1 (matching the time of pre-treatment and treatment in previous experiments). (B) A polyclonal population of U2OS-EGFP-LC3 cells was treated with full-nutrient media and BafA1 for 90 min (matching the time of preincubation and treatment for previous experiments) and imaged. The mean fluorescent intensity of the green channel (an indicator of relative EGFP-LC3 levels) and mean area of AVs (in µm2) was plotted for individual cells (n = 27). The solid trendline indicates a positive correlation, which is consistent with the model prediction in (A).