Figures & data
Figure 1. ATG7 deficiency in mouse liver causes hepatomegaly and reveals signs of defective autophagy. (A) Gross anatomical view of a representative Atg7+/+ Alb-Cre+ and Atg7F/F Alb-Cre+ mouse (5 mo old). (B and C) western blot (B) and ultrastructural analysis (C) of liver samples from Atg7+/+ Alb-Cre+ and Atg7F/F Alb-Cre+ mice. Ultrastructural inspection of Atg7F/F Alb-Cre+ livers reveals accumulation of elongated and deformed mitochondria (black arrows) as well as a decrease in glycogen granules and endoplasmic reticulum. Livers from Atg7+/+ Alb-Cre+ mice show normal cell morphology. Scale bar, 2 μm. n, nucleus.
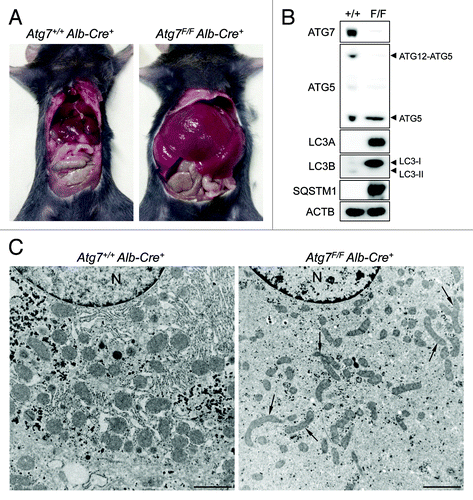
Figure 2. Nutrient deprivation induces autophagy in liver from GFP-LC3 transgenic mice. (A) Examination of GFP fluorescence in liver of GFP-LC3 transgenic mice before (0 h) and after starvation (24 or 48 h). Scale bar, 20 μm. Formation of GFP-LC3 dots during starvation was quantified. **p < 0.01 vs. 0 h (one-way ANOVA, followed by Dunnett test, n = 9). (B) Fatty change of liver tissue as demonstrated by oil red O staining before (0 h) and after starvation (48 h). Scale bar, 20 μm. (C) Ultrastructural characterization of liver tissue from GFP-LC3 mice before (0 h) and after starvation (48 h). The micrographs of starved liver show accumulation of lipid droplets (asterisks) and autophagic vacuoles (arrows). Scale bar, 2 μm. N indicates the nucleus. (D) Western blot analysis of liver from GFP-LC3 mice before and after starvation.
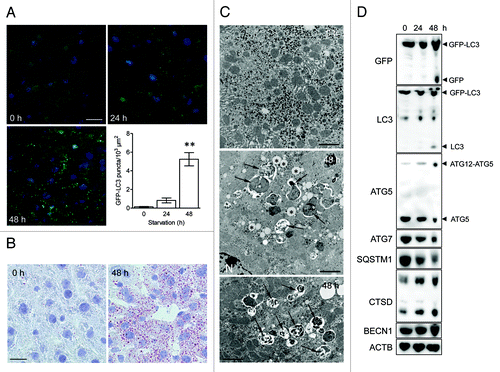
Figure 3. Rabbit polyclonal LC3B antibodies show crossreactivity with LC3A protein. Western blots containing recombinant LC3A and LC3B (5–20 ng) protein were probed with the following antibodies: mouse monoclonal antiLC3B (Nanotools), rabbit monoclonal antiLC3B (Cell Signaling), rabbit polyclonal antiLC3A (Abgent) and rabbit polyclonal antiLC3B from Novus Biologicals and Santa Cruz Biotechnology.
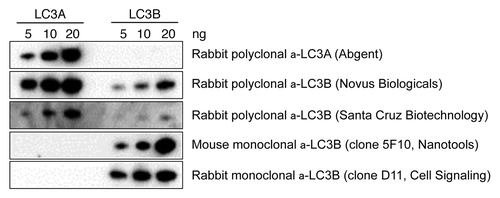
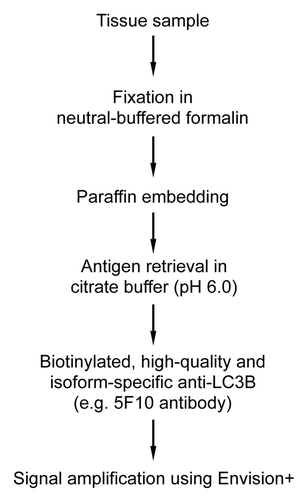
Figure 4. Liver from autophagy-deficient Atg7F/F Alb-Cre+ mice but not from autophagy-competent Atg7+/+ Alb-Cre+ shows immunohistochemical staining for LC3A and LC3B. Liver samples were isolated from fed mice (control) or from mice that underwent starvation for 48 h. After fixation in neutral buffered formalin for 24 h, tissues were paraffin-embedded and stained for LC3A (A) and LC3B (B) using rabbit polyclonal anti-LC3A (Abgent, 1:100) and biotinylated mouse monoclonal anti-LC3B (clone 5F10, Nanotools, 1:100) in combination with Vectastain ABC. Heat-mediated antigen retrieval was performed in citrate buffer (pH 6.0). Scale bar, 20 μm. The LC3A and LC3B positive area was quantified. ***p < 0.001 vs. Atg7+/+ Alb-Cre+ mice (two-way ANOVA, n = 10).
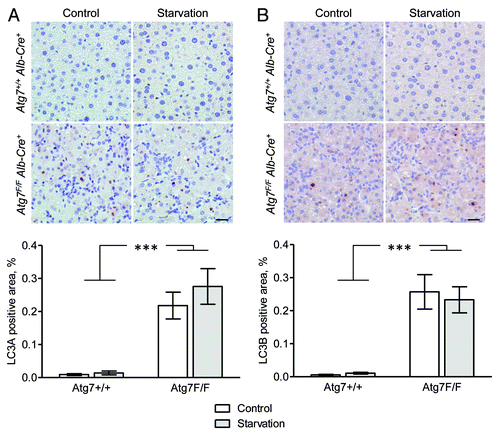
Figure 5. The highest expression of LC3A and LC3B in nonstarved control mice was found in brain tissue. (A) Western blot analysis of LC3A and LC3B in different tissue lysates. GAPDH served as a loading control. (B) Immunohistochemical detection of LC3A and LC3B in mouse brain using the Vectastain ABC system. Tissue samples were isolated from fed control mice. After fixation in neutral buffered formalin for 24 h, tissues were paraffin-embedded and stained for LC3A (A) and LC3B (B) using rabbit polyclonal anti-LC3A (Abgent, 1:3000) and biotinylated mouse monoclonal anti-LC3B (clone 5F10, Nanotools, 1:100). Heat-mediated antigen retrieval was performed in citrate buffer (pH 6.0). Scale bar, 20 μm.
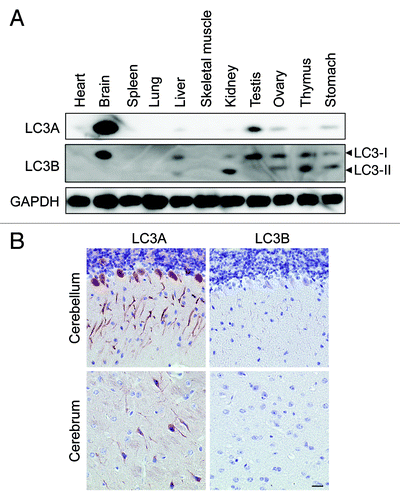
Figure 6. Immunohistochemical detection of LC3B is feasible in liver from starved Gfp-Lc3tg/tg mice using Vectastain ABC. (A) Western blot analysis of LC3B in liver from wild-type mice, heterozygous Gfp-Lc3tg/+ or homozygous Gfp-Lc3tg/tg transgenic mice. The GFP-LC3 expression in each group was quantified. **p < 0.01 vs. wild-type mice (one-way ANOVA, followed by Dunnett test, n = 4). (B) Immunohistochemical detection of LC3B in liver from Gfp-Lc3tg/+ or Gfp-Lc3tg/tg mice using the Vectastain ABC system. Liver samples were isolated from fed mice (control) or from mice that underwent starvation for 48 h. After fixation in neutral buffered formalin for 24 h, tissues were paraffin-embedded and stained for LC3B using biotinylated mouse monoclonal anti-LC3B (clone 5F10, Nanotools, 1:100). Heat-mediated antigen retrieval was performed in citrate buffer (pH 6.0). Scale bar, 20 μm. The LC3B positive area was quantified. ***p < 0.001 vs. control (two way ANOVA, followed by Bonferroni post test, n = 10).
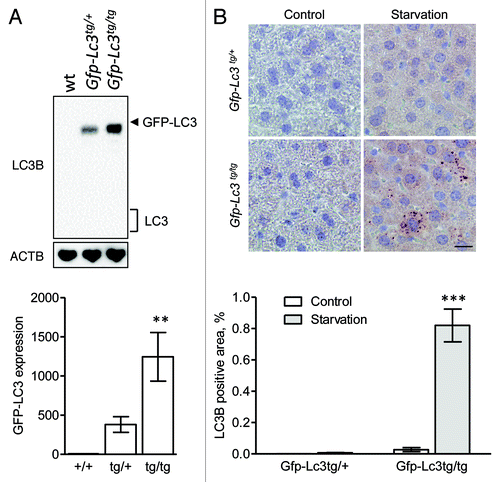
Figure 7. Optimal immunohistochemical detection of LC3B requires processing of tissue samples in a suitable fixative. Liver samples were isolated from Gfp-Lc3tg/tg mice that underwent starvation for 48 h. After fixation in different fixatives for 24 h, tissues were paraffin-embedded and stained for LC3B using biotinylated mouse monoclonal anti-LC3B (clone 5F10, Nanotools, 1:100) and Vectastain ABC. For formalin-fixed samples, heat-mediated antigen retrieval was performed either in citrate buffer (pH 6.0) or in EDTA buffer (pH 8.0). Scale bar, 20 μm.
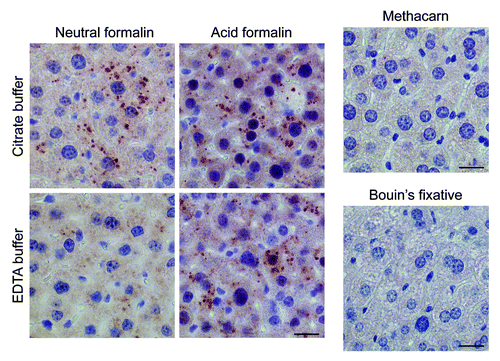
Figure 8. Immunohistochemical staining of LC3B is enhanced in frozen liver sections. Liver samples were isolated from Atg7+/+ Alb-Cre+ and Atg7F/F Alb-Cre+ mice (A) or from transgenic Gfp-Lc3tg/+ or Gfp-Lc3tg/tg mice (B). Some animals were fed normal chow (control), others underwent starvation for 48 h. After fixation in acetone, frozen sections were stained for LC3B using biotinylated mouse monoclonal anti-LC3B (clone 5F10, Nanotools, 1:1,000 [Atg7+/+ Alb-Cre+ and Atg7F/F Alb-Cre+ samples] or 1:30,000 [Gfp-Lc3tg/+ and Gfp-Lc3tg/tg samples]) and Vectastain ABC. Scale bar, 40 μm.
![Figure 8. Immunohistochemical staining of LC3B is enhanced in frozen liver sections. Liver samples were isolated from Atg7+/+ Alb-Cre+ and Atg7F/F Alb-Cre+ mice (A) or from transgenic Gfp-Lc3tg/+ or Gfp-Lc3tg/tg mice (B). Some animals were fed normal chow (control), others underwent starvation for 48 h. After fixation in acetone, frozen sections were stained for LC3B using biotinylated mouse monoclonal anti-LC3B (clone 5F10, Nanotools, 1:1,000 [Atg7+/+ Alb-Cre+ and Atg7F/F Alb-Cre+ samples] or 1:30,000 [Gfp-Lc3tg/+ and Gfp-Lc3tg/tg samples]) and Vectastain ABC. Scale bar, 40 μm.](/cms/asset/e048f347-0a4e-4bc3-9163-8da4ce5e1834/kaup_a_10922968_f0008.gif)
Figure 9. LC3B dots are detectable in frozen liver sections using a staining procedure with alkaline phosphatase and are localized on the surface of lipid droplets. Liver samples were isolated from Atg7+/+ Alb-Cre+ (A) or Atg7F/F Alb-Cre+ mice (B) that were fed normal chow (control) or underwent starvation for 48 h. After fixation in 4% paraformaldehyde, frozen sections were stained for LC3B using biotinylated mouse monoclonal anti-LC3B (clone 5F10, Nanotools, 1:1,000) and Vectastain ABC-AP kit, containing biotinylated alkaline phosphatase instead of biotinylated horseradish peroxidase. LC3B-positive dots (arrows) were detected on the surface of lipid droplets. These structures could be stained using oil red O. Scale bar, 20 μm.
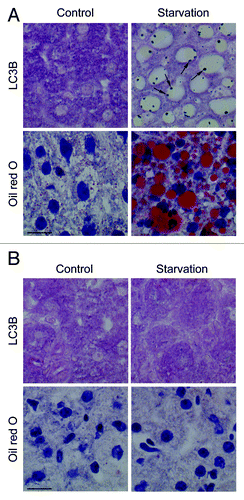
Figure 10. Envision+ enhances the immunohistochemical detection of LC3B in GFP-LC3 transgenic mice. Liver samples were isolated from fed wild-type, Gfp-Lc3tg/+ or Gfp-Lc3tg/tg mice (control) and from mice that underwent starvation for 48 h. After fixation in neutral buffered formalin for 24 h, tissues were paraffin-embedded and stained for LC3B using rabbit monoclonal anti-LC3B (clone D11, Cell Signaling, 1:100 [wild-type]; 1:300 [Gfp-Lc3tg/+] or 1:1,000 [Gfp-Lc3tg/tg]) and Envision+. Heat-mediated antigen retrieval was performed in citrate buffer (pH 6.0). Scale bar, 20 μm. The LC3B positive area was quantified. ***p < 0.001 vs. control (two-way ANOVA, followed by Bonferroni post test, n = 10).
![Figure 10. Envision+ enhances the immunohistochemical detection of LC3B in GFP-LC3 transgenic mice. Liver samples were isolated from fed wild-type, Gfp-Lc3tg/+ or Gfp-Lc3tg/tg mice (control) and from mice that underwent starvation for 48 h. After fixation in neutral buffered formalin for 24 h, tissues were paraffin-embedded and stained for LC3B using rabbit monoclonal anti-LC3B (clone D11, Cell Signaling, 1:100 [wild-type]; 1:300 [Gfp-Lc3tg/+] or 1:1,000 [Gfp-Lc3tg/tg]) and Envision+. Heat-mediated antigen retrieval was performed in citrate buffer (pH 6.0). Scale bar, 20 μm. The LC3B positive area was quantified. ***p < 0.001 vs. control (two-way ANOVA, followed by Bonferroni post test, n = 10).](/cms/asset/a3b90d44-830f-4aa5-9e68-2a7883096a65/kaup_a_10922968_f0010.gif)
Figure 11. Livers from starved wild-type mice show background staining with anti-mouse Envision+. (A) Anti-mouse Envision+ without primary antibody results in background staining of Atg7+/+ Alb-Cre+ liver, but not of Atg7F/F Alb-Cre+ liver. (B) Liver samples were isolated from fed Atg7+/+ Alb-Cre+ and Atg7F/F Alb-Cre+ mice (control) or from mice that underwent starvation for 48 h. After fixation in neutral buffered formalin for 24 h, tissues were paraffin-embedded and stained for LC3B using unconjugated mouse monoclonal anti-LC3B (clone 5F10, Nanotools, 1:100), in combination with Envision+. Heat-mediated antigen retrieval was performed in citrate buffer (pH 6.0). Scale bar, 20 μm. One panel of starved Atg7+/+ Alb-Cre+ hepatocytes (around blood vessel) was taken at higher magnification and illustrates tiny LC3B positive puncta.
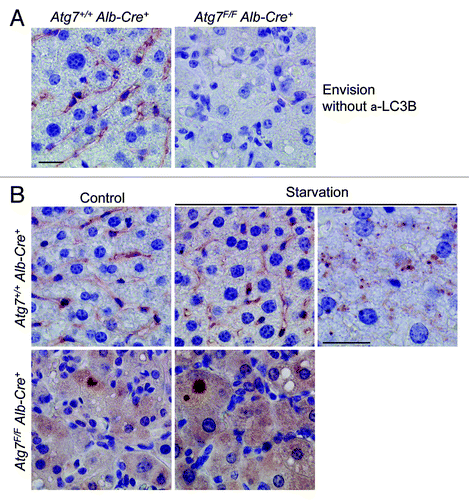
Figure 12. Monoclonal 5F10 LC3B antibody combined with Envision+ allows the immunohistochemical detection of LC3B in different organs of starved Gfp-Lc3tg/tg mice. Gfp-Lc3tg/tg mice were fed regular chow (control) or underwent starvation for 48 h. Tissue samples from different organs were collected and fixed in neutral buffered formalin for 24 h. Thereafter, tissues were paraffin-embedded and stained for LC3B using unconjugated mouse monoclonal anti-LC3B (clone 5F10, Nanotools, 1:1000) and Envision+. Heat-mediated antigen retrieval was performed in citrate buffer (pH 6.0). Scale bar, 20 μm.
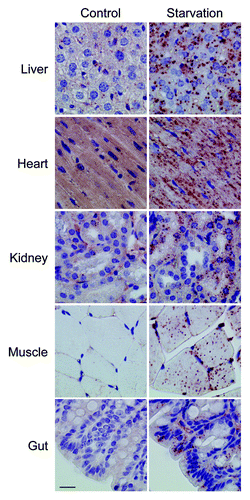
Figure 13. ATG5 and CTSD are not suitable targets for the immunohistochemical detection of autophagy in liver. Liver samples were isolated from fed Atg7+/+ Alb-Cre+ and Atg7F/F Alb-Cre+ mice (control) or from mice that underwent starvation for 48 h. After fixation in neutral buffered formalin for 24 h, tissues were paraffin-embedded and stained for ATG5 (A) or CTSD (B) using rabbit polyclonal anti-ATG5 (Abcam, 1:100) and rabbit monoclonal anti-CTSD (clone EPR3057Y, Abcam, 1:1000), respectively, in combination with Vectastain ABC. Heat-mediated antigen retrieval was performed in citrate buffer (pH 6.0). Scale bar, 20 μm. The ATG5- and CTSD-positive area was quantified. Neither the effect of starvation nor the results between Atg7+/+ Alb-Cre+ and Atg7F/F Alb-Cre+ mice were statistically significant.
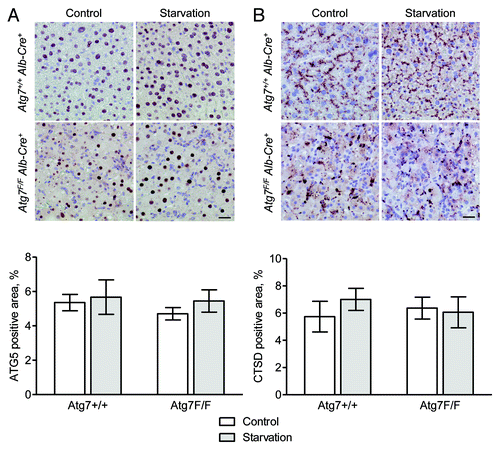
Figure 14. BECN1 is upregulated in mouse tissue after starvation. (A) Liver samples were isolated from fed Atg7+/+ Alb-Cre+ and Atg7F/F Alb-Cre+ mice (control) or from mice that underwent starvation for 48 h. After fixation in neutral buffered formalin for 24 h, tissues were paraffin-embedded and stained for BECN1 using rabbit polyclonal anti-BECN1 (Lifespan, 1:1,000) and Vectastain ABC. Heat-mediated antigen retrieval was performed in citrate buffer (pH 6.0). Scale bar 20 μm. The BECN1 positive area was quantified. ***p < 0.001 vs. control (two-way ANOVA with Bonferroni post test, n, 10). (B) BECN1 immunohistocehmical staining in kidney from Atg7+/+ Alb-Cre+ mice before and after starvation (48 h). Scale bar, 20 μm.
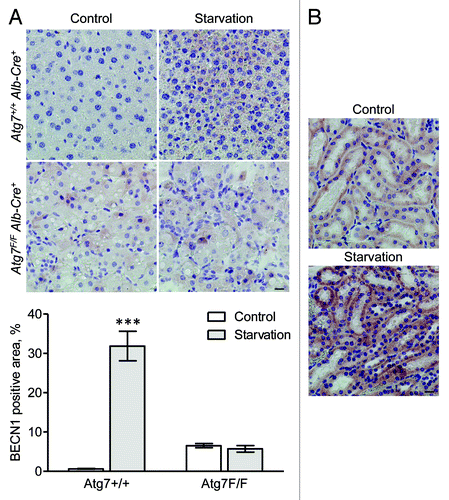
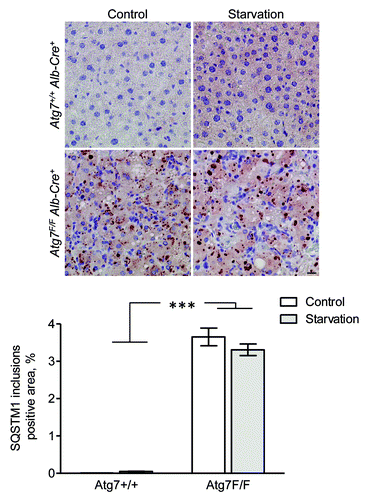
Figure 15. SQSTM1 accumulates in cytoplasmic inclusions of liver from autophagy-deficient mice. Liver samples were isolated from fed Atg7+/+ Alb-Cre+ and Atg7F/F Alb-Cre+ mice (control) or from mice that underwent starvation for 48 h. After fixation in neutral buffered formalin for 24 h, tissues were paraffin-embedded and stained for SQSTM1 using rabbit polyclonal anti-SQSTM1 (Sigma, 1:5,000) and Vectastain ABC. Heat-mediated antigen retrieval was performed in citrate buffer (pH 6.0). Scale bar, 20 μm. The positive area of SQSTM1 inclusions was quantified. ***p < 0.001 vs. Atg7+/+ Alb-Cre+ mice (two-way ANOVA, n, 10).
