Figures & data
Figure 1. BNIP3 is induced by hypoxia and downregulated by starvation. (A) Human hepatocellular carcinoma cells (SK-Hep-1), breast cancer cells (MCF-7), cervical cancer cells (HeLa), osteoblast cells (U2OS) and human embryonic kidney cells (HEK293) were respectively incubated under normoxia (21% O2), hypoxia (1% O2) for 24 h or hypoxia followed by amino acid starvation for an additional 4 h. Changes in BNIP3 levels were analyzed by western blotting. (B) Those five different human cell lines were treated with 100 μM deferoxamine (DFO) for 24 h in the normoxic condition followed by amino acid starvation for 4 h.
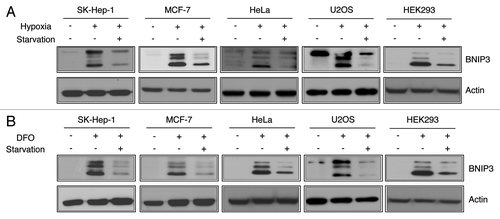
Figure 2. Amino acid deprivation does not alter the mRNA level of BNIP3 but significantly decreases its protein level through lysosomal degradation. (A) SK-Hep-1 cells were exposed to normoxia (21% O2), hypoxia (1% O2) or hypoxia followed by starvation for 4 h, respectively. After starvation, total RNA was isolated and analyzed to quantify the BNIP3 mRNA levels by real-time quantitative PCR. (B) The protein levels of HIF1A, LDHA and BNIP3 were analyzed by western-blot analysis. (C) Flag-tagged BNIP3 was transiently expressed in SK-Hep-1 cells, which were subjected to starvation for 4 h. BNIP3 was detected by western blot, using an anti-Flag antibody. (D) SK-Hep-1 cells were incubated for 24 h under normoxic or hypoxic conditions with or without additional starvation in the presence or absence of 100 μM cycloheximide (CHX) and subjected to western blot analysis. CHX-induced translational inhibition was confirmed by monitoring the level of TP53. The protein level of BNIP3 was analyzed by densitometry using the ImageJ software program. (E) SK-Hep-1 cells were incubated for 24 h under normoxic or hypoxic conditions. The cells were then treated with 20 μM MG132, 10 mM 3MA or 10 nM BafA1 in the presence or absence of amino acids for an additional 4 h. (F) SK-Hep-1 cells were exposed to hypoxia for 24 h and treated with 20 μM MG132 and/or 10 nM BafA1 under starved conditions for additional 4 h of hypoxia. Inhibition of autophagy was confirmed by western blot analysis of SQSTM1 and MAP1LC3B. Inhibition of proteasome was assessed by TP53 expression level. The protein level of BNIP3 was analyzed by densitometry using the ImageJ software program. The data are shown as means ± SD for three independent experiments. *p < 0.005, t test; n.s., not significant.
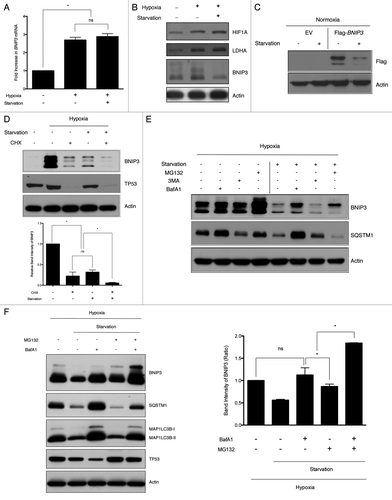
Figure 3. BNIP3 degradation is mediated by macroautophagy, which is dependent on the ATG7-MAP1LC3 conjugation system. (A) SK-Hep-1 cells were treated with nontargeting (negative control, NC) or LAMP2 siRNAs for 48 h, and subjected to hypoxia for 24 h, followed by amino acid starvation for 4 h. BNIP3 protein levels were then analyzed by western blotting. (B) SK-Hep-1 cells were exposed to hypoxia for 24 h, followed by starvation for 4 h in the presence or absence of 50 μM vinblastine. BNIP3 expression and autophagy inhibition were analyzed by western blot. SK-Hep-1 cells were treated with nontargeting (NC), BECN1 (C) and MAP1LC3B (D) siRNAs for 48 h, followed by hypoxic exposure for 24 h, and then by amino acid starvation for 4 h. Autophagy induction and BNIP3 degradation were analyzed by western blotting. (E) Scrambled shRNA (NC) and ATG7 shRNA (shATG7) were transfected into SK-Hep-1 cells respectively. Knockdown of ATG7 was confirmed by western blot analysis. Two different shRNAs, shATG7(1) and shATG7(2), were used and a clone with more effective knockdown was selected. Stable cell lines were incubated under hypoxia (1% O2) for 24 h with or without additional starvation for 4 h. The expression level of BNIP3 was analyzed by western blotting.
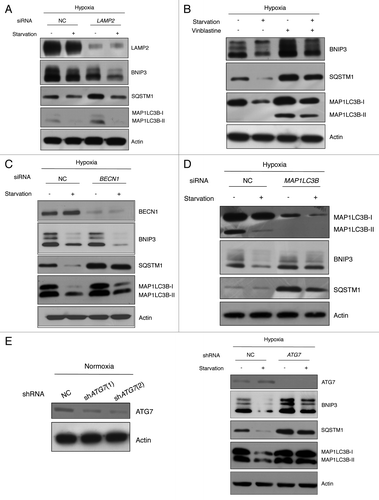
Figure 4. BNIP3 degradation is not dependent on BNIP3 translocation to mitochondria. (A) Full-length BNIP3 or BNIP3 lacking TM domain (BNIP3∆TM) was expressed in SK-Hep-1 cells, and its localization was visualized by immunofluorescence microscopy. Nuclei were stained with Hoechst 33342, and mitochondria were detected with Mito-tracker Red. Full-length BNIP3 and BNIP3∆TM were detected with an anti-Flag antibody and visualized with FITC-conjugated anti-mouse IgG. (B) Flag-tagged BNIP3 and BNIP3∆TM were transiently expressed in SK-Hep-1 cells. At 24 h after transfection, the cells were incubated with or without starvation and subjected to western-blot analysis. (C) Various mitochondrion-associated proteins were analyzed by western blotting following hypoxia or hypoxia plus starvation. Mitochondrial autophagy was assessed according to the expression level of mitochondrial membrane proteins, COX4I1 and TOMM20 (left panel). The data are shown as means ± SD for three independent experiments. *p < 0.0005, t test.
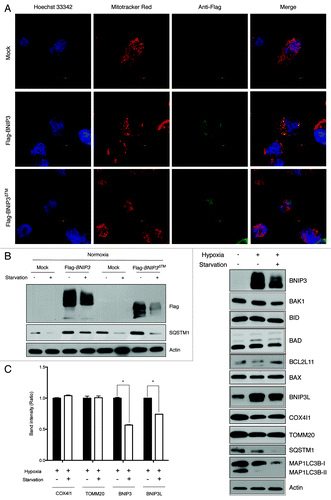
Figure 5. BNIP3 degradation is independent of SQSTM1 or NBR1. (A) SK-Hep-1 cells were transfected with empty vector (EV), Flag-BNIP3 or Flag-BNIP3∆TM under normoxia for 24 h and challenged with amino acid starvation in the presence or absence of BafA1 and/or MG132. BNIP3 protein was immunoprecipitated with anti-Flag antibody. Ubiquitination and SQSTM1 interaction were assessed by western-blot analysis. (B) SK-Hep-1 cells were transfected with SQSTM1 for 48 h followed by the overexpression of Flag-BNIP3 or Flag-BNIP3∆TM under normoxia for 24 h and challenged with amino acid starvation or Torin1 treatment. BNIP3 expression was analyzed by western blot using anti-Flag antibody. Autophagy was assessed by the MAP1LC3B expression level. (C) SK-Hep-1 cells were transfected with SQSTM1 or NBR1 siRNA for 48 h and exposed to hypoxia for 24 h. Amino acid starvation were challenged for an additional 4 h, followed by western blot analysis.
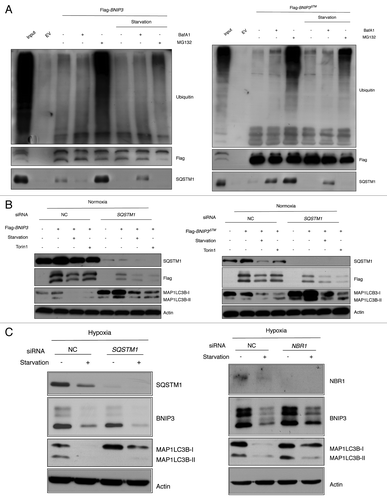
Figure 6. BNIP3 degradation is mediated by MTORC1 inhibition. (A) SK-Hep-1 cells were cultured under hypoxia (1% O2) for 24 h. Torin1 was added for additional 4 h at the indicated dose, which was analyzed by western blot. The inhibition of MTORC1, BNIP3 degradation and autophagy induction were confirmed by western blot analysis. (B) SK-Hep-1 cells were transfected with MTOR or RPTOR siRNA and then exposed to hypoxia for 24 h followed by western-blot analysis. (C) SK-Hep-1 cells were exposed to hypoxia for 24 h, after which the cells were treated with 250 nM Torin1 in the presence or absence of 10 nM BafA1. The ratio of MAP1LC3B-I to MAP1LC3B-II was assessed by densitometry. (D) Negative control and RPS6KB1 siRNAs were transfected into SK-Hep-1 cells for 48 h. The transfected cells were incubated under normoxia or hypoxia for 24 h and were subjected to western-blot analysis.
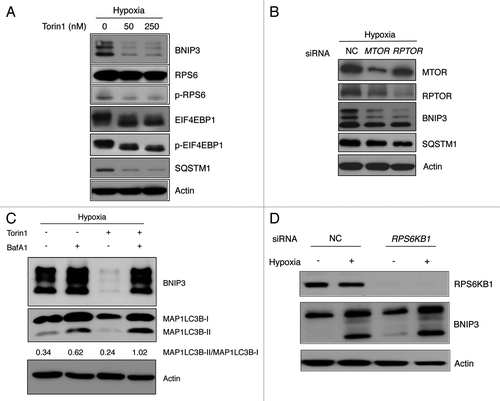
Figure 7. BNIP3 degradation is regulated by ULK1 via MTORC1 and AMPK. (A) SK-Hep-1 cells were transfected with ULK1 siRNA for 48 h and exposed to hypoxia for 24 h followed by amino acid starvation or Torin1 treatment for additional 4 h and cells subjected to western-blot analysis. (B) SK-Hep-1 cells were incubated under hypoxic conditions for 24 h and then treated with 250 nM Torin1, 5 mM metformin or 20 μM Compound C for 4 h. MTORC1 inhibition and AMPK activation or inhibition were confirmed by western blotting. ULK1 inhibition was assessed by the level of p-ULK1 (S757), and ULK1 activation by that of p-ULK1 (S555).
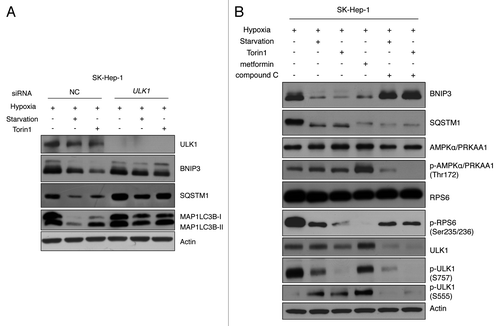
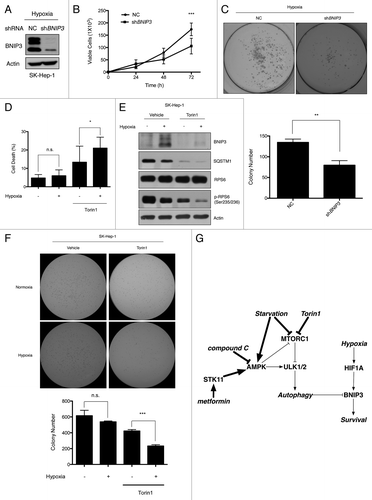
Figure 8. The viability of tumor cells is reduced in response to the loss of BNIP3 or Torin1 treatment. (A) Scrambled shRNA and BNIP3 shRNA were transfected into SK-Hep-1 cells. Knockdown of BNIP3 was confirmed by western-blot analysis. (B) Selected stable cell lines were incubated under hypoxic conditions for up to 72 h. The proliferation rate was assessed by counting viable cells at indicated time points. (C) For measurements of colony-forming ability, stable cell lines were plated at a low density (1000 cells/well) in 6-well plates and then incubated under hypoxic conditions for 7 d. Colonies were fixed and stained with crystal violet, and colony numbers were then counted using ImageJ software program (n = 3). (D) SK-Hep-1 cells were cultured under normoxia or hypoxia for 24 h, which was followed by the Torin1 treatment for additional 24 h. Cell death was assessed by the trypan blue assay. (E) BNIP3 degradation, MTORC1 inhibition and autophagy induction were confirmed by western-blot analysis. (F) SK-Hep-1 cells were cultured under normoxic or hypoxic conditions for 24 h and then treated with Torin1 for 24 h. After treatment, the cells were harvested and seeded in soft agar followed by incubation under hypoxia. Two weeks after the incubation, the cells were stained with crystal violet, and the colonies were counted by the ImageJ software program. (G) Schematic diagram of BNIP3 regulation by ULK1-dependent autophagy via MTORC1 and AMPK. The data are shown as means ± SD of three independent experiments performed in triplicate. t test; *p < 0.05, **p < 0.005, ***p < 0.0005, n.s., not significant.