3,294
Views
133
CrossRef citations to date
0
Altmetric
Basic Research Paper

MIR181A regulates starvation- and rapamycin-induced autophagy through targeting of ATG5

, , , &
Pages 374-385 | Received 19 Apr 2012, Accepted 04 Dec 2012, Published online: 15 Jan 2013

Figures & data

Figure 1. Overexpression of MIR181A resulted in decreased autophagic activity in MCF-7 cells. (A) MIR181A blocked starvation-induced GFP-LC3 dot formation in MCF-7 cells. Cells were cotransfected with MIR181A or control construct (MIR-CNT) together with GFP-LC3 plasmid and autophagy was assessed under no starvation or starvation (2 h) conditions. White arrows indicate clusters of the GFP-LC3 dots in cells. (B) Quantitative analysis of the experiments in (A). MIR181A overexpression, but not control (MIR-CNT) overexpression, blocked starvation-induced autophagy (mean ± SD of independent experiments, n = 3, **p < 0.01. N.S., not significant). (C) MIR181A decreased starvation-induced conversion of LC3-I to LC3-II in MCF-7 cells. Immunoblot results of extracts from nonstarved (STV-) or starved (STV+) cells (n = 3). LC3-II/LC3-I densitometric ratios are marked. ACTB was used as a loading control. (D) MIR181A blocked starvation induced SQSTM1 degradation in MCF-7 cells (n = 3). ACTB was used as a loading control. SQSTM1/ACTB densitometric ratios were marked. (E) MIR181A blocked rapamycin-induced GFP-LC3 dot formation. Cells were cotransfected with GFP-LC3 plasmid and MIR181A or MIR-CNT, treated with DMSO (carrier) or rapamycin (2.5 µM, 24 h). (F) Quantitative analysis of the experiments in (E) (mean ± SD of independent experiments, n = 4, *p < 0.05. N.S., not significant). (G) MIR181A decreased LC3-I to LC3-II conversion stimulated by rapamycin (RAP) in MCF-7 cells (n = 2). LC3-II/LC3-I ratios are marked. (H) MIR181A blocked rapamycin-induced SQSTM1 degradation in MCF-7 cells (n = 2).
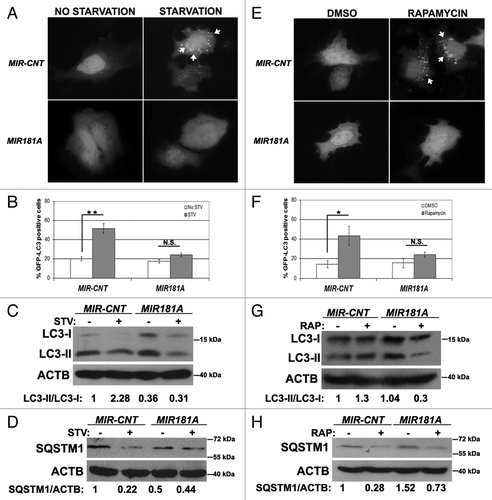
Figure 1. Overexpression of MIR181A resulted in decreased autophagic activity in MCF-7 cells. (A) MIR181A blocked starvation-induced GFP-LC3 dot formation in MCF-7 cells. Cells were cotransfected with MIR181A or control construct (MIR-CNT) together with GFP-LC3 plasmid and autophagy was assessed under no starvation or starvation (2 h) conditions. White arrows indicate clusters of the GFP-LC3 dots in cells. (B) Quantitative analysis of the experiments in (A). MIR181A overexpression, but not control (MIR-CNT) overexpression, blocked starvation-induced autophagy (mean ± SD of independent experiments, n = 3, **p < 0.01. N.S., not significant). (C) MIR181A decreased starvation-induced conversion of LC3-I to LC3-II in MCF-7 cells. Immunoblot results of extracts from nonstarved (STV-) or starved (STV+) cells (n = 3). LC3-II/LC3-I densitometric ratios are marked. ACTB was used as a loading control. (D) MIR181A blocked starvation induced SQSTM1 degradation in MCF-7 cells (n = 3). ACTB was used as a loading control. SQSTM1/ACTB densitometric ratios were marked. (E) MIR181A blocked rapamycin-induced GFP-LC3 dot formation. Cells were cotransfected with GFP-LC3 plasmid and MIR181A or MIR-CNT, treated with DMSO (carrier) or rapamycin (2.5 µM, 24 h). (F) Quantitative analysis of the experiments in (E) (mean ± SD of independent experiments, n = 4, *p < 0.05. N.S., not significant). (G) MIR181A decreased LC3-I to LC3-II conversion stimulated by rapamycin (RAP) in MCF-7 cells (n = 2). LC3-II/LC3-I ratios are marked. (H) MIR181A blocked rapamycin-induced SQSTM1 degradation in MCF-7 cells (n = 2).

Figure 2. Effect of MI181A on autophagy is not cell-type dependent. (A) MIR181A blocked starvation-induced GFP-LC3 dot formation in Huh-7 cells. Cells were cotransfected with GFP-LC3 plasmid and MIR181A or MIR-CNT and autophagy was assessed under no starvation or starvation (4 h) conditions. (B) Quantitative analysis of the experiments in (A) (mean ± SD of independent experiments, n = 3, *p < 0.05. N.S., not significant). (C) MIR181A expression decreased starvation-induced LC3-I to LC3-II conversion in Huh-7 cells (n = 3). LC3-II/LC3-I ratios are marked. (D) MIR181A blocked starvation-induced SQSTM1 degradation in Huh-7 cells (n = 2). SQSTM1/ACTB ratios are marked. (E) MIR181A blocked rapamycin-induced GFP-LC3 dot formation. Autophagy was assessed following DMSO or rapamycin treatment (2.5 µM, 24 h). (F) Quantitative analysis of the experiments in (E) (mean ± SD of independent experiments, n = 3, **p < 0.01. N.S., not significant). (G) MIR181A resulted in decreased rapamycin-induced conversion of LC3-I to LC3-II in Huh-7 cells (n = 2). RAP, rapamycin. LC3-II/LC3-I ratios are marked. (H) MIR181A blocked rapamycin-induced SQSTM1 degradation in Huh-7 cells (n = 2). SQSTM1/ACTB ratios are marked.
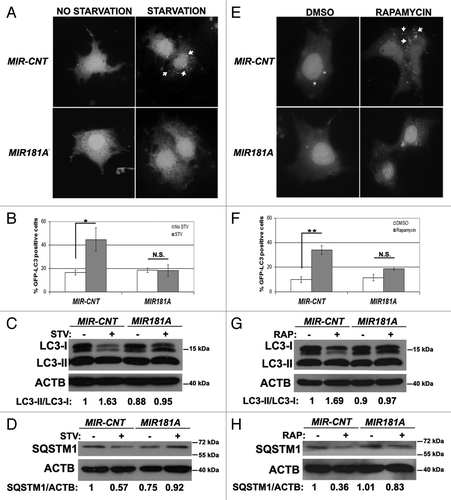
Figure 2. Effect of MI181A on autophagy is not cell-type dependent. (A) MIR181A blocked starvation-induced GFP-LC3 dot formation in Huh-7 cells. Cells were cotransfected with GFP-LC3 plasmid and MIR181A or MIR-CNT and autophagy was assessed under no starvation or starvation (4 h) conditions. (B) Quantitative analysis of the experiments in (A) (mean ± SD of independent experiments, n = 3, *p < 0.05. N.S., not significant). (C) MIR181A expression decreased starvation-induced LC3-I to LC3-II conversion in Huh-7 cells (n = 3). LC3-II/LC3-I ratios are marked. (D) MIR181A blocked starvation-induced SQSTM1 degradation in Huh-7 cells (n = 2). SQSTM1/ACTB ratios are marked. (E) MIR181A blocked rapamycin-induced GFP-LC3 dot formation. Autophagy was assessed following DMSO or rapamycin treatment (2.5 µM, 24 h). (F) Quantitative analysis of the experiments in (E) (mean ± SD of independent experiments, n = 3, **p < 0.01. N.S., not significant). (G) MIR181A resulted in decreased rapamycin-induced conversion of LC3-I to LC3-II in Huh-7 cells (n = 2). RAP, rapamycin. LC3-II/LC3-I ratios are marked. (H) MIR181A blocked rapamycin-induced SQSTM1 degradation in Huh-7 cells (n = 2). SQSTM1/ACTB ratios are marked.

Figure 3. Inhibition of endogenous MIR181A using antagomirs (Ant-181a) stimulated autophagic activity. (A) Ant-181a enhanced starvation-induced GFP-LC3 dot formation. CNT-Ant, control antagomirs. (B) Quantitative analysis of the experiments in (A). NO STV, No starvation. STV, starvation for 20 min. (mean ± SD of independent experiments, n = 3, *p < 0.05, **p < 0.01). (C) Ant-181a, but not CNT-Ant stimulated starvation (STV, 4 h)-stimulated LC3-I to LC3-II conversion in MCF-7 cells (n = 4). LC3-II/LC3-I densitometric ratios are marked. (D) Ant-181a, but not CNT-Ant resulted in the stimulation of SQSTM1 protein degradation following starvation (4 h) in MCF-7 cells (n = 3). SQSTM1/ACTB ratios are marked.
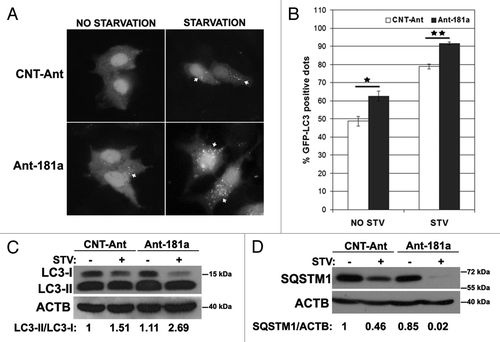
Figure 3. Inhibition of endogenous MIR181A using antagomirs (Ant-181a) stimulated autophagic activity. (A) Ant-181a enhanced starvation-induced GFP-LC3 dot formation. CNT-Ant, control antagomirs. (B) Quantitative analysis of the experiments in (A). NO STV, No starvation. STV, starvation for 20 min. (mean ± SD of independent experiments, n = 3, *p < 0.05, **p < 0.01). (C) Ant-181a, but not CNT-Ant stimulated starvation (STV, 4 h)-stimulated LC3-I to LC3-II conversion in MCF-7 cells (n = 4). LC3-II/LC3-I densitometric ratios are marked. (D) Ant-181a, but not CNT-Ant resulted in the stimulation of SQSTM1 protein degradation following starvation (4 h) in MCF-7 cells (n = 3). SQSTM1/ACTB ratios are marked.

Figure 4.MIR181A affected ATG5 levels in MCF-7 cells. (A) MIR181A target sequence in the 3′ UTR of the ATG5 mRNA. The MIR181A seed sequence is marked in italics. (B) ATG5 protein levels were decreased following MIR181A overexpression in MCF-7 cells. Immunoblots of MIR-CNT or MIR181A transfected cells that were nonstarved (STV-) or starved (STV+) (n = 3). ACTB was used as a loading control. ATG5/ACTB band densitometric ratios are shown. (C) Quantitative PCR (qPCR) analysis of ATG5 mRNA levels in control (MIR-CNT) or MIR181A transfected MCF-7 cells (mean ± SD of independent experiments, n = 3, *p < 0.05). Data were normalized using GAPDH mRNA. (D) ATG5 protein levels were increased following antagomir-181a (Ant-181a) transfection. CNT-Ant, control antagomirs (n = 2). ATG5/ACTB ratios are shown.
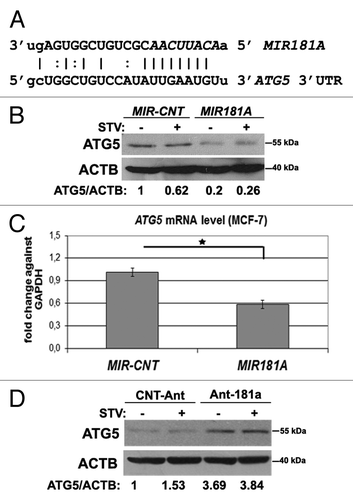
Figure 4.MIR181A affected ATG5 levels in MCF-7 cells. (A) MIR181A target sequence in the 3′ UTR of the ATG5 mRNA. The MIR181A seed sequence is marked in italics. (B) ATG5 protein levels were decreased following MIR181A overexpression in MCF-7 cells. Immunoblots of MIR-CNT or MIR181A transfected cells that were nonstarved (STV-) or starved (STV+) (n = 3). ACTB was used as a loading control. ATG5/ACTB band densitometric ratios are shown. (C) Quantitative PCR (qPCR) analysis of ATG5 mRNA levels in control (MIR-CNT) or MIR181A transfected MCF-7 cells (mean ± SD of independent experiments, n = 3, *p < 0.05). Data were normalized using GAPDH mRNA. (D) ATG5 protein levels were increased following antagomir-181a (Ant-181a) transfection. CNT-Ant, control antagomirs (n = 2). ATG5/ACTB ratios are shown.

Figure 5. ATG5 overexpression rescued cells from MIR181A-mediated autophagy inhibition. MCF-7 cells were cotransfected with MIR181A or MIR-CNT and an ATG5 expression plasmid lacking the MIR181A target region. Autophagy was evaluated. (A) Immunoblot analysis of showing ATG5 and ACTB protein levels following indicated transfections (n = 2). ATG5/ACTB ratios are shown. (B) GFP-LC3 dot formation before or after starvation (2 h). ATG5, MIR181A-insensitive ATG5 expression plasmid. (C) Quantitative analysis of GFP-LC3 dot formation (mean ± SD of independent experiments, n = 3, **p < 0.01 and ***p < 0.001).
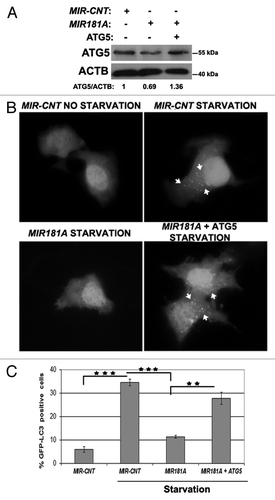
Figure 5. ATG5 overexpression rescued cells from MIR181A-mediated autophagy inhibition. MCF-7 cells were cotransfected with MIR181A or MIR-CNT and an ATG5 expression plasmid lacking the MIR181A target region. Autophagy was evaluated. (A) Immunoblot analysis of showing ATG5 and ACTB protein levels following indicated transfections (n = 2). ATG5/ACTB ratios are shown. (B) GFP-LC3 dot formation before or after starvation (2 h). ATG5, MIR181A-insensitive ATG5 expression plasmid. (C) Quantitative analysis of GFP-LC3 dot formation (mean ± SD of independent experiments, n = 3, **p < 0.01 and ***p < 0.001).

Figure 6. ATG5 as a direct target of MIR181A and changes in endogenous MIR181A levels during cellular stress. (A) A scheme representing luciferase constructs with wild-type (wt) or mutant 3′ UTR MIR181A MRE sequences of ATG5. Mutations are marked in lower case letters and underlined. (B) Normalized luciferase activity in lysates from 293T cells co-transfected with wild-type or mutant ATG5-luciferase constructs and MIR181A or MIR-CNT (mean ± SD of independent experiments, n = 3, **p < 0.01. N.S., not significant). (C) TaqMan quantitative PCR (qPCR) analysis of endogenous MIR181A levels under control (CNT, no starvation) or starvation (STV, 2 h and 4 h) conditions. Endogenous MIR181A levels were not responsive to starvation treatment (mean ± SD of independent experiments, n = 3, N.S., not significant). TaqMan qPCR data were normalized using U6 small nuclear 1 (RNU6-1) (U6) mRNA levels. (D) TaqMan qPCR analysis of endogenous MIR181A levels in cells treated with DMSO (carrier) or rapamycin. Endogenous MIR181A levels were increased following rapamycin treatment (mean ± SD of independent experiments, n = 4, *p < 0.05).
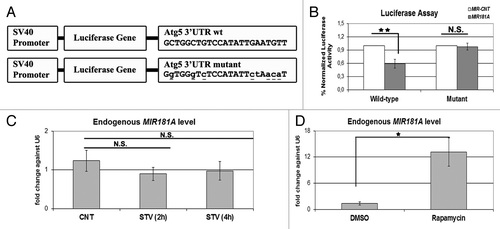
Figure 6. ATG5 as a direct target of MIR181A and changes in endogenous MIR181A levels during cellular stress. (A) A scheme representing luciferase constructs with wild-type (wt) or mutant 3′ UTR MIR181A MRE sequences of ATG5. Mutations are marked in lower case letters and underlined. (B) Normalized luciferase activity in lysates from 293T cells co-transfected with wild-type or mutant ATG5-luciferase constructs and MIR181A or MIR-CNT (mean ± SD of independent experiments, n = 3, **p < 0.01. N.S., not significant). (C) TaqMan quantitative PCR (qPCR) analysis of endogenous MIR181A levels under control (CNT, no starvation) or starvation (STV, 2 h and 4 h) conditions. Endogenous MIR181A levels were not responsive to starvation treatment (mean ± SD of independent experiments, n = 3, N.S., not significant). TaqMan qPCR data were normalized using U6 small nuclear 1 (RNU6-1) (U6) mRNA levels. (D) TaqMan qPCR analysis of endogenous MIR181A levels in cells treated with DMSO (carrier) or rapamycin. Endogenous MIR181A levels were increased following rapamycin treatment (mean ± SD of independent experiments, n = 4, *p < 0.05).

Figure 7. A model depicting the effect of MIR181A on autophagy pathways. MIR181A regulates stress-induced autophagy by targeting the key autophagy protein ATG5. The resulting decrease in ATG12–ATG5-ATG16L1 activity leads to attenuation of LC3 lipidation and inhibits the membrane elongation and completion stage of autophagy.
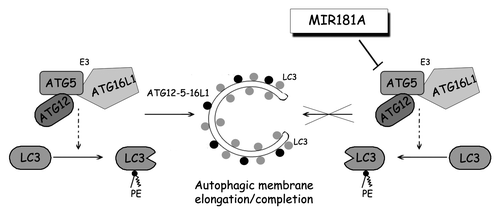
Figure 7. A model depicting the effect of MIR181A on autophagy pathways. MIR181A regulates stress-induced autophagy by targeting the key autophagy protein ATG5. The resulting decrease in ATG12–ATG5-ATG16L1 activity leads to attenuation of LC3 lipidation and inhibits the membrane elongation and completion stage of autophagy.
Supplemental material

Additional material

Download Zip (738.1 KB)

Reprints and Corporate Permissions

Please note: Selecting permissions does not provide access to the full text of the article, please see our help page How do I view content?

To request a reprint or corporate permissions for this article, please click on the relevant link below:

Academic Permissions

Please note: Selecting permissions does not provide access to the full text of the article, please see our help page How do I view content?

Obtain permissions instantly via Rightslink by clicking on the button below:

If you are unable to obtain permissions via Rightslink, please complete and submit this Permissions form. For more information, please visit our Permissions help page.