3,524
Views
103
CrossRef citations to date
0
Altmetric
Basic Research Paper

Suberoylanilide hydroxamic acid (SAHA) causes tumor growth slowdown and triggers autophagy in glioblastoma stem cells

, , , &
Pages 1509-1526 | Received 05 Apr 2012, Accepted 08 Jul 2013, Published online: 15 Aug 2013

Figures & data

Figure 1. HDAC inhibitor SAHA decreased cellular proliferation and colony formation ability of GSCs in vitro. (A) The morphology of GSCs cultured in the gelatin foam present at spheroid formation after 7 d, as observed using SEM analysis. (B) The morphology of GSCs cultured in culture dish as an adherent model system after 7 d, as observed using SEM analysis. Scale bars: 30 μm. (C) Three types of GSCs, including undifferentiated model, spheroids and adherent or differentiated model (Diff.), as described in the text, were treated with 5 μM SAHA for 1 to 3 d. Phase contrast pictures taken at 200 × 200 μm per square. (D) Models of adherent GSCs and differentiated GSCs were treated with 5 μM SAHA for 1 to 7 d and loss of viability was determined by the MTT assay. “*” indicates significant difference from vehicle control of GSCs and p < 0.05 on Student’s t-test. (E) Colony formation was drastically reduced in SAHA-treated GSCs (spheroid model) and differentiated GSCs after 48 h and continued to decrease in a dose-dependent manner. The number of colonies was counted under a dissecting microscope. The number of cells in each colony had to be larger than 50. The data include the relative colony number, and the number of cells without SAHA treatment (as vehicle control) was set at 100%. (F) Spheroid GSCs were treated with 5 μM SAHA for the indicated number of days and then harvested for protein analysis. Cell lysates were resolved in SDS-PAGE and probed with specific antibodies against cleaved PARP, CASP3 and GAPDH. (G) Spheroid GSCs (1 × 10⁶ cells) were treated with 0, 5 and 20 μM of SAHA in the presence of the 10 nM rapamycin for 48 h. Western blot analysis was performed to detect expression of the cleaved PARP and active cleaved CASP3. (H) In some of the above experiments, cell viability of adherent GSCs was determined by MTT assay, as described in Materials and Methods. The data represent the mean and SEM of three independent experiments. *p < 0.05 compared with control using the Student's t-test. “#” indicates significantly different from 20 μM SAHA-alone treatment and p < 0.05 on Student’s t-test.
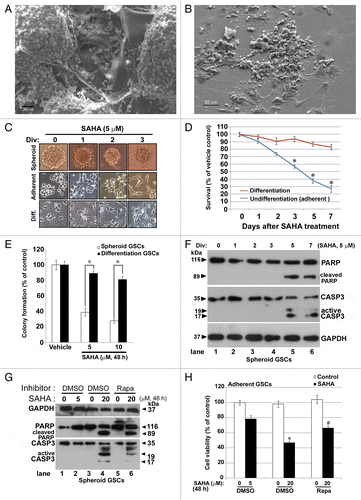
Figure 1. HDAC inhibitor SAHA decreased cellular proliferation and colony formation ability of GSCs in vitro. (A) The morphology of GSCs cultured in the gelatin foam present at spheroid formation after 7 d, as observed using SEM analysis. (B) The morphology of GSCs cultured in culture dish as an adherent model system after 7 d, as observed using SEM analysis. Scale bars: 30 μm. (C) Three types of GSCs, including undifferentiated model, spheroids and adherent or differentiated model (Diff.), as described in the text, were treated with 5 μM SAHA for 1 to 3 d. Phase contrast pictures taken at 200 × 200 μm per square. (D) Models of adherent GSCs and differentiated GSCs were treated with 5 μM SAHA for 1 to 7 d and loss of viability was determined by the MTT assay. “*” indicates significant difference from vehicle control of GSCs and p < 0.05 on Student’s t-test. (E) Colony formation was drastically reduced in SAHA-treated GSCs (spheroid model) and differentiated GSCs after 48 h and continued to decrease in a dose-dependent manner. The number of colonies was counted under a dissecting microscope. The number of cells in each colony had to be larger than 50. The data include the relative colony number, and the number of cells without SAHA treatment (as vehicle control) was set at 100%. (F) Spheroid GSCs were treated with 5 μM SAHA for the indicated number of days and then harvested for protein analysis. Cell lysates were resolved in SDS-PAGE and probed with specific antibodies against cleaved PARP, CASP3 and GAPDH. (G) Spheroid GSCs (1 × 10⁶ cells) were treated with 0, 5 and 20 μM of SAHA in the presence of the 10 nM rapamycin for 48 h. Western blot analysis was performed to detect expression of the cleaved PARP and active cleaved CASP3. (H) In some of the above experiments, cell viability of adherent GSCs was determined by MTT assay, as described in Materials and Methods. The data represent the mean and SEM of three independent experiments. *p < 0.05 compared with control using the Student's t-test. “#” indicates significantly different from 20 μM SAHA-alone treatment and p < 0.05 on Student’s t-test.

Figure 2. SAHA caused tumor growth slowdown and induction of autophagy in nude mice xenografts of GSCs. (A) The spheroid GSCs (1 × 10⁶ cells) were mixed with 30 μl matrigels and inoculated subcutaneously into nude mice (n = 3 for each group). When the tumors reached 200 mm3 in volume, intraperitoneal injections of SAHA (100 mg/kg body weight) were administered every 24 h for 7 d and tumor volume was measured every 7 d after the cessation of treatment (mean ± SEM). There were highly significant differences at the end (day 49 and 56) of the treatment period (p = 0.031). “*” indicates significantly different from placebo group and p < 0.05 on Student’s t-test. (B) The protein expression levels of LC3 flux, BECN1 and PARP in xenograft tumor were determined by western blotting. GAPDH was a loading control. (C) Top panels: Hematoxylin-eosin staining of a representative section. Xenograft tumor initiated from GSCs exhibited morphologic characteristics of glioma, including marked cellular pleomorphism, large, round nuclei prominent nucleoli, abundant cytoplasm and vasculogenic tubular formation (black arrowheads; placebo, left upper panel), whereas there were significant decreases in tubular structures and increases in differentiated cells in the SAHA treatment (SAHA, right upper panel). Note the presence of vacuolated cytoplasm, fragmented tumor cells, and isolated nuclei of tumor cells characterized by dense eosinophilic cytoplasm and hyperchromatic nuclear fragments (marked by black arrows). Center and bottom panels show the immunochemical staining results for the autophagy BECN1 marker and diagnostic marker of GBM: GFAP. Immunohistochemistry detected BECN1 rarely and, when found, only surrounded the vascular-like channel structures (placebo, center left), whereas the section of SAHA treatment revealed diffuse staining of BECN1 in necrotic parts of the tumor cell cytoplasms, and at the perinuclear region (red arrows), with a relocation of BECN1 around the nucleus (green arrowheads) and at the frontier of the necrotic part of some cells (center right). Bottom panels show the protein expressions of GFAP that served as diagnostic controls. Insert panels show a higher magnification, and each square represents 100 × 100 μm. Scale bars: 500 μm (upper panels) and 50 μm (center and bottom panels).
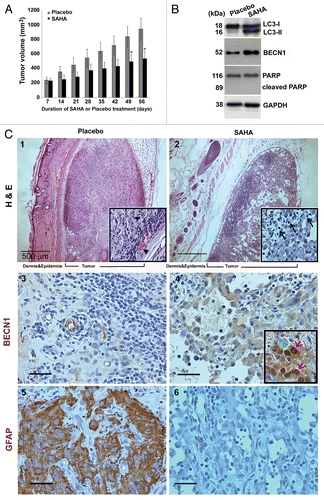
Figure 2. SAHA caused tumor growth slowdown and induction of autophagy in nude mice xenografts of GSCs. (A) The spheroid GSCs (1 × 10⁶ cells) were mixed with 30 μl matrigels and inoculated subcutaneously into nude mice (n = 3 for each group). When the tumors reached 200 mm3 in volume, intraperitoneal injections of SAHA (100 mg/kg body weight) were administered every 24 h for 7 d and tumor volume was measured every 7 d after the cessation of treatment (mean ± SEM). There were highly significant differences at the end (day 49 and 56) of the treatment period (p = 0.031). “*” indicates significantly different from placebo group and p < 0.05 on Student’s t-test. (B) The protein expression levels of LC3 flux, BECN1 and PARP in xenograft tumor were determined by western blotting. GAPDH was a loading control. (C) Top panels: Hematoxylin-eosin staining of a representative section. Xenograft tumor initiated from GSCs exhibited morphologic characteristics of glioma, including marked cellular pleomorphism, large, round nuclei prominent nucleoli, abundant cytoplasm and vasculogenic tubular formation (black arrowheads; placebo, left upper panel), whereas there were significant decreases in tubular structures and increases in differentiated cells in the SAHA treatment (SAHA, right upper panel). Note the presence of vacuolated cytoplasm, fragmented tumor cells, and isolated nuclei of tumor cells characterized by dense eosinophilic cytoplasm and hyperchromatic nuclear fragments (marked by black arrows). Center and bottom panels show the immunochemical staining results for the autophagy BECN1 marker and diagnostic marker of GBM: GFAP. Immunohistochemistry detected BECN1 rarely and, when found, only surrounded the vascular-like channel structures (placebo, center left), whereas the section of SAHA treatment revealed diffuse staining of BECN1 in necrotic parts of the tumor cell cytoplasms, and at the perinuclear region (red arrows), with a relocation of BECN1 around the nucleus (green arrowheads) and at the frontier of the necrotic part of some cells (center right). Bottom panels show the protein expressions of GFAP that served as diagnostic controls. Insert panels show a higher magnification, and each square represents 100 × 100 μm. Scale bars: 500 μm (upper panels) and 50 μm (center and bottom panels).

Figure 4. SAHA triggered autophagy flux in GSCs. (A) Conversions of LC3-I to LC3-II and the protein levels of BECN1 and SQSTM1 were determined by western blotting after spheroid GSCs (5 × 10⁵ cells/ 60 mm dish) treated with various concentration (0, 2.5, 5, 10 and 20 μM) of SAHA for 48 h. GAPDH was a loading control. (B) Following above experimental conditions, micrographs showed the appearance of vesicular organelles in the adherent GSCs (phase contrast; blue fluorescence: Hoechst33342 staining as nuclear; B-1, B-4). AVOs induced by 5 μM SAHA were stained with acridine orange (red fluorescence: AVOs; B-5) and 0.05 mM MDC (green fluorescence; B-6). (C) Adherent GSCs were treated with the presence or absence (vehicle control) of the HDAC inhibitor, SAHA, at 5 μM for 48 h, and then stained with LC3 antibody and Hoechst 33342. Immunocytochemical detection of endogenous levels for LC3 (green fluorescence) was visualized on confocal microscope (C-1, C-2). Bottom panels (C-3, C-4) were merged with Hoechst 33342 (blue fluorescence, nuclei) and phase contrast (original magnification, ×1200; scale bars: 20 μm). (D) Time-dependent (0, 6, 12, 24 and 48 h) increase in dephosphorylation of endogenous AKTt and MTOR following SAHA (5 μM) treatment. Each protein was determined on western blot using a specific antibody or phospho-specific antibody as indicated on the left side of each strip. GAPDH protein levels serve as loading controls. Each square represents 100 × 100 μm in (B).
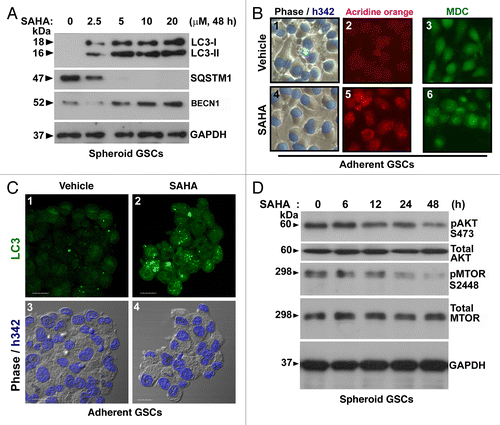
Figure 4. SAHA triggered autophagy flux in GSCs. (A) Conversions of LC3-I to LC3-II and the protein levels of BECN1 and SQSTM1 were determined by western blotting after spheroid GSCs (5 × 10⁵ cells/ 60 mm dish) treated with various concentration (0, 2.5, 5, 10 and 20 μM) of SAHA for 48 h. GAPDH was a loading control. (B) Following above experimental conditions, micrographs showed the appearance of vesicular organelles in the adherent GSCs (phase contrast; blue fluorescence: Hoechst33342 staining as nuclear; B-1, B-4). AVOs induced by 5 μM SAHA were stained with acridine orange (red fluorescence: AVOs; B-5) and 0.05 mM MDC (green fluorescence; B-6). (C) Adherent GSCs were treated with the presence or absence (vehicle control) of the HDAC inhibitor, SAHA, at 5 μM for 48 h, and then stained with LC3 antibody and Hoechst 33342. Immunocytochemical detection of endogenous levels for LC3 (green fluorescence) was visualized on confocal microscope (C-1, C-2). Bottom panels (C-3, C-4) were merged with Hoechst 33342 (blue fluorescence, nuclei) and phase contrast (original magnification, ×1200; scale bars: 20 μm). (D) Time-dependent (0, 6, 12, 24 and 48 h) increase in dephosphorylation of endogenous AKTt and MTOR following SAHA (5 μM) treatment. Each protein was determined on western blot using a specific antibody or phospho-specific antibody as indicated on the left side of each strip. GAPDH protein levels serve as loading controls. Each square represents 100 × 100 μm in (B).

Figure 3. SAHA induced autophagosome formation. Representative ultra-structures using transmission electron micrographs of GSCs treated with either DMSO (control, < 0.1%) or 5 μM SAHA for 48 h. (A) Nuclear and mitochondrial morphologies are normal in control cells (original magnification, ×6000). Control cells also contained a richly granular cytoplasm, relatively more mitochondria. (B) SAHA treatment of GSCs for 48 h resulted in the development of autophagic vacuoles (original magnification, ×6000). The cells exhibited a sparsely granular cytoplasm, few mitochondria, and vacuoles containing membranous and partially degraded granular cytoplasm indicative of autophagic activity. (C) Amplification (original magnification, ×20000) from the square region of (B). Arrowheads denote representative autophagic vacuoles that contain remnant of organelles. N, nucleus; M, mitochondria; L, lysosome. (DF) are pictures with higher magnification showing detailed autophagosome structure. Some of these vacuoles contained remnants of organelles, including mitochondria (D), (E: arrows) and endoplasmic reticulum (F: arrowhead). The cells with autophagic vacuoles were defined as cells that had five or more autophagic vacuoles. For these treatments, TEM images were randomly chosen, from a field of at least 100 cells. Scale bars: 2 μm; 1 μm (indicated enlargements).
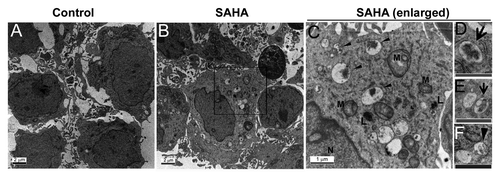
Figure 3. SAHA induced autophagosome formation. Representative ultra-structures using transmission electron micrographs of GSCs treated with either DMSO (control, < 0.1%) or 5 μM SAHA for 48 h. (A) Nuclear and mitochondrial morphologies are normal in control cells (original magnification, ×6000). Control cells also contained a richly granular cytoplasm, relatively more mitochondria. (B) SAHA treatment of GSCs for 48 h resulted in the development of autophagic vacuoles (original magnification, ×6000). The cells exhibited a sparsely granular cytoplasm, few mitochondria, and vacuoles containing membranous and partially degraded granular cytoplasm indicative of autophagic activity. (C) Amplification (original magnification, ×20000) from the square region of (B). Arrowheads denote representative autophagic vacuoles that contain remnant of organelles. N, nucleus; M, mitochondria; L, lysosome. (D–F) are pictures with higher magnification showing detailed autophagosome structure. Some of these vacuoles contained remnants of organelles, including mitochondria (D), (E: arrows) and endoplasmic reticulum (F: arrowhead). The cells with autophagic vacuoles were defined as cells that had five or more autophagic vacuoles. For these treatments, TEM images were randomly chosen, from a field of at least 100 cells. Scale bars: 2 μm; 1 μm (indicated enlargements).

Figure 5. Effects of autophagy inhibitors and knockdown of autophagy-related genes on SAHA-induced autophagy and cytotoxicity in GSCs. (A) Spheroid GSCs (1 × 10⁶ cells/60-mm dish) were treated with 5 μM SAHA alone or pretreated with 5 mM 3-MA or 50 nM wortmannin for 1 h, then treated with SAHA (5 μM) for 24 h, and then harvested for analysis by western blot and detection of LC3, BECN1, SQSTM1, cleaved PARP and CASP3. In some experimental groups, cell viability of adherent GSCs (5 × 10³ cells/well of 96-well plate) was analyzed on MTT assay (C). (B) Equal amounts of spheroid GSCs total cell lysates from shLuc, shLC3, shBECN1 and shATG5 GSCs (1 × 10⁶ cells/ 60 mm dish) after 5 μM SAHA treatment for 48 h were analyzed by western blot assays for LC3, BECN1, ATG5 and SQSTM1 to confirm the lack of LC3, BECN1 and ATG5 expression in GSCs. GAPDH was a loading control. In some experimental groups, cell viability of adherent GSCs was analyzed using the MTT assay (D). (E) Spheroid GSCs were treated with 25 nM BafA1 or ATG5 gene knockdown alone or in combination with 5 μM SAHA or 20 μM z-VAD for 48 h and then harvested for western blot analysis. Cell lysates were resolved in SDS-PAGE and probed with indicated antibodies. (F) In some experimental groups, cell viability was determined by the MTT assay after the treatment of adherent GSCs for 24 h. The data represent the mean and SEM of three independent experiments. *p < 0.05 compared with control on Student t-test.
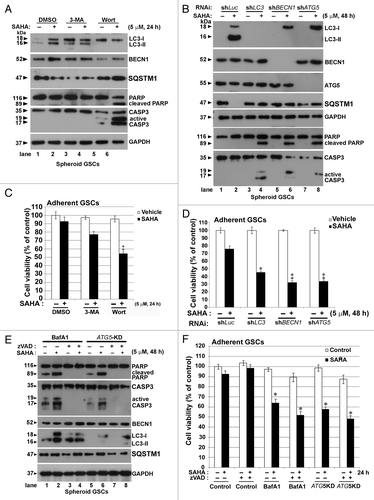
Figure 5. Effects of autophagy inhibitors and knockdown of autophagy-related genes on SAHA-induced autophagy and cytotoxicity in GSCs. (A) Spheroid GSCs (1 × 10⁶ cells/60-mm dish) were treated with 5 μM SAHA alone or pretreated with 5 mM 3-MA or 50 nM wortmannin for 1 h, then treated with SAHA (5 μM) for 24 h, and then harvested for analysis by western blot and detection of LC3, BECN1, SQSTM1, cleaved PARP and CASP3. In some experimental groups, cell viability of adherent GSCs (5 × 10³ cells/well of 96-well plate) was analyzed on MTT assay (C). (B) Equal amounts of spheroid GSCs total cell lysates from shLuc, shLC3, shBECN1 and shATG5 GSCs (1 × 10⁶ cells/ 60 mm dish) after 5 μM SAHA treatment for 48 h were analyzed by western blot assays for LC3, BECN1, ATG5 and SQSTM1 to confirm the lack of LC3, BECN1 and ATG5 expression in GSCs. GAPDH was a loading control. In some experimental groups, cell viability of adherent GSCs was analyzed using the MTT assay (D). (E) Spheroid GSCs were treated with 25 nM BafA1 or ATG5 gene knockdown alone or in combination with 5 μM SAHA or 20 μM z-VAD for 48 h and then harvested for western blot analysis. Cell lysates were resolved in SDS-PAGE and probed with indicated antibodies. (F) In some experimental groups, cell viability was determined by the MTT assay after the treatment of adherent GSCs for 24 h. The data represent the mean and SEM of three independent experiments. *p < 0.05 compared with control on Student t-test.

Figure 6. Inhibition of autophagy by CQ augmented SAHA-induced apoptosis in GSCs. (A) PI stain was performed after spheroid GSCs had been exposed to DMSO (vehicle), 5 μM SAHA alone, a combination of 25 μM CQ and 5 μM SAHA or 25 μM CQ alone for 24 h. (B) Spheroid GSCs were treated with SAHA (0 or 5 μM with/without CQ (25 μM) for 24 h. TUNEL assay was performed after the above procedure and finally an analysis was conducted by flow cytometry. **p < 0.01 on Student’s t-test, GSCs cotreated with SAHA and CQ compared with GSCs treated without CQ. #p < 0.05 on Student’s t-test, GSCs cotreatment with NAC, SAHA and CQ compared with GSCs cotreated with SAHA plus CQ. (C) Spheroid GSCs were treated SAHA (S: 5 μM) with/without CQ (25 μM) or NAC (10 mM) for 24 h. western blotting analysis was performed after the above procedure for spheroid GSCs, and to determine the conversions of LC3-I to LC3-II, cleaved CASP3 and PARP. In addition, the proteins of SQSTM1 were extracted by PARP buffer containing 2% (insoluble SQSTM1) or 0.1% SDS (soluble SQSTM1). GAPDH was a loading control. V: vehicle control; S: 5 μM SAHA; S+C: 5 μM SAHA + 25 μM CQ; C: 25 μM CQ, treatment for 24 h.
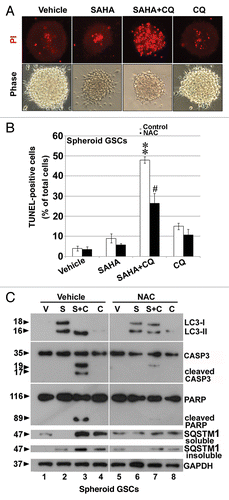
Figure 6. Inhibition of autophagy by CQ augmented SAHA-induced apoptosis in GSCs. (A) PI stain was performed after spheroid GSCs had been exposed to DMSO (vehicle), 5 μM SAHA alone, a combination of 25 μM CQ and 5 μM SAHA or 25 μM CQ alone for 24 h. (B) Spheroid GSCs were treated with SAHA (0 or 5 μM with/without CQ (25 μM) for 24 h. TUNEL assay was performed after the above procedure and finally an analysis was conducted by flow cytometry. **p < 0.01 on Student’s t-test, GSCs cotreated with SAHA and CQ compared with GSCs treated without CQ. #p < 0.05 on Student’s t-test, GSCs cotreatment with NAC, SAHA and CQ compared with GSCs cotreated with SAHA plus CQ. (C) Spheroid GSCs were treated SAHA (S: 5 μM) with/without CQ (25 μM) or NAC (10 mM) for 24 h. western blotting analysis was performed after the above procedure for spheroid GSCs, and to determine the conversions of LC3-I to LC3-II, cleaved CASP3 and PARP. In addition, the proteins of SQSTM1 were extracted by PARP buffer containing 2% (insoluble SQSTM1) or 0.1% SDS (soluble SQSTM1). GAPDH was a loading control. V: vehicle control; S: 5 μM SAHA; S+C: 5 μM SAHA + 25 μM CQ; C: 25 μM CQ, treatment for 24 h.

Figure 7. Reduced dose of SAHA induced differentiation in GSCs. (A) Immunofluorescence staining was performed after spheroid GSCs (PROM1 and NES, green) and adherent GSCs (TUBB3, green; GFAP, red; nuclear, blue: stained by Hoechst 33324 as nuclear counterstains) had been exposed to DMSO (vehicle), 2.5 μM SAHA alone, a combination of 5 mM 3-MA plus 2.5 μM SAHA or 25 μM CQ plus 2.5 μM SAHA for 7 d. Each square represents 200 × 200 μm. (B) Similar to the above conditions, spheroid GSCs were harvested and immunoblotting assays were performed to detect the protein levels of PROM1, NES, TUBB3 and GFAP for the 7th and 14th day. Div: days in vitro. (C) Equal amounts of spheroid GSC total cell lysates from shLuc, shLC3, shBECN1 and shATG5 GSCs (1 × 10⁶ cells/60-mm dish) after 0 or 2.5 μM SAHA treatment for 7 d were analyzed by western blot to assess the presence of PROM1, NES, TUBB3 and GFAP. GAPDH was a loading control. (D) Adherent GSCs were treated with determination of senescence by colorimetric senescence-associated GLB1 activity assay at the 7th day in the presence or absence of SAHA (2.5 μM) induced differentiation of spheroid GSCs. Original magnification, ×400. Scale bars: 50 μm. (E) Determination of cell death using PI staining at the 7th day in the presence or absence of SAHA (2.5 μM) was not showed significant effect to affect cell death in adherent GSCs. Original magnification, ×40. Scale bars: 500 μm. (F) Using the MTT assays, SAHA-mediated cytotoxicity (2.5 μM treated for indicated time points) was analyzed in adherent GSCs. (1 × 10⁴ cells/ well of 96-well plate). *p < 0.05 compared with control on Student t-test. Data were representative of three independent experiments with similar results. Div, days in vitro.
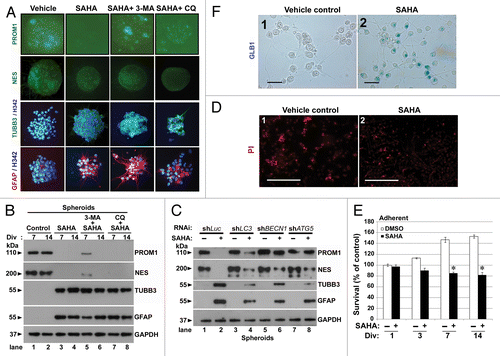
Figure 7. Reduced dose of SAHA induced differentiation in GSCs. (A) Immunofluorescence staining was performed after spheroid GSCs (PROM1 and NES, green) and adherent GSCs (TUBB3, green; GFAP, red; nuclear, blue: stained by Hoechst 33324 as nuclear counterstains) had been exposed to DMSO (vehicle), 2.5 μM SAHA alone, a combination of 5 mM 3-MA plus 2.5 μM SAHA or 25 μM CQ plus 2.5 μM SAHA for 7 d. Each square represents 200 × 200 μm. (B) Similar to the above conditions, spheroid GSCs were harvested and immunoblotting assays were performed to detect the protein levels of PROM1, NES, TUBB3 and GFAP for the 7th and 14th day. Div: days in vitro. (C) Equal amounts of spheroid GSC total cell lysates from shLuc, shLC3, shBECN1 and shATG5 GSCs (1 × 10⁶ cells/60-mm dish) after 0 or 2.5 μM SAHA treatment for 7 d were analyzed by western blot to assess the presence of PROM1, NES, TUBB3 and GFAP. GAPDH was a loading control. (D) Adherent GSCs were treated with determination of senescence by colorimetric senescence-associated GLB1 activity assay at the 7th day in the presence or absence of SAHA (2.5 μM) induced differentiation of spheroid GSCs. Original magnification, ×400. Scale bars: 50 μm. (E) Determination of cell death using PI staining at the 7th day in the presence or absence of SAHA (2.5 μM) was not showed significant effect to affect cell death in adherent GSCs. Original magnification, ×40. Scale bars: 500 μm. (F) Using the MTT assays, SAHA-mediated cytotoxicity (2.5 μM treated for indicated time points) was analyzed in adherent GSCs. (1 × 10⁴ cells/ well of 96-well plate). *p < 0.05 compared with control on Student t-test. Data were representative of three independent experiments with similar results. Div, days in vitro.
Supplemental material

Additional material

Download Zip (690 KB)

Reprints and Corporate Permissions

Please note: Selecting permissions does not provide access to the full text of the article, please see our help page How do I view content?

To request a reprint or corporate permissions for this article, please click on the relevant link below:

Academic Permissions

Please note: Selecting permissions does not provide access to the full text of the article, please see our help page How do I view content?

Obtain permissions instantly via Rightslink by clicking on the button below:

If you are unable to obtain permissions via Rightslink, please complete and submit this Permissions form. For more information, please visit our Permissions help page.