4,007
Views
116
CrossRef citations to date
0
Altmetric
Basic Research Paper

Dynamin 1-like-dependent mitochondrial fission initiates overactive mitophagy in the hepatotoxicity of cadmium

, , , , , , , , , , , , , , & show all
Pages 1780-1800 | Received 08 Nov 2012, Accepted 08 Jul 2013, Published online: 04 Sep 2013

Figures & data

Figure 1. Cd triggers significant mitochondrial loss and bioenergetic deficits in L02 cells. After L02 cells were treated with various doses of CdCl2 (0, 3, 6, or 12 μM) for 12 h. (A) NAO staining was used to analyze mitochondrial mass using an Infinite™ M200 Microplate Reader. (B) A representative immunoblot and quantification analysis of COX4I1 (17 kDa) in L02 cells. ACTB (42 kDa) was the internal standard for protein loading. (C) Quantitative real-time PCR analysis was applied to detect mtDNA copy number. (D) The ATP concentrations and (E) cell viabilities were determined using an ATP Determination Kit and a CCK-8 Determination Kit. The data are representative of 4 independent experiments. The results are expressed as a percentage of control, which was set at 100%. The values are the means ± SEM; *P < 0.05, **P < 0.01 vs. the control group.
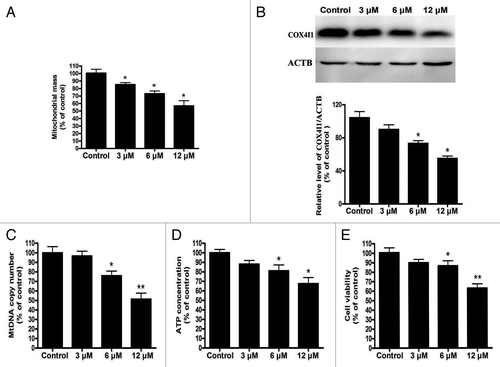
Figure 1. Cd triggers significant mitochondrial loss and bioenergetic deficits in L02 cells. After L02 cells were treated with various doses of CdCl2 (0, 3, 6, or 12 μM) for 12 h. (A) NAO staining was used to analyze mitochondrial mass using an Infinite™ M200 Microplate Reader. (B) A representative immunoblot and quantification analysis of COX4I1 (17 kDa) in L02 cells. ACTB (42 kDa) was the internal standard for protein loading. (C) Quantitative real-time PCR analysis was applied to detect mtDNA copy number. (D) The ATP concentrations and (E) cell viabilities were determined using an ATP Determination Kit and a CCK-8 Determination Kit. The data are representative of 4 independent experiments. The results are expressed as a percentage of control, which was set at 100%. The values are the means ± SEM; *P < 0.05, **P < 0.01 vs. the control group.

Figure 2A and B. Cd triggers mitophagy in L02 cells. (A) A representative immunoblot and quantification analysis of LC3 protein levels (17 kDa) in L02 cells. ACTB (42 kDa) was the internal standard for protein loading. (B) Electron microscopy revealed an increased number of AVs.
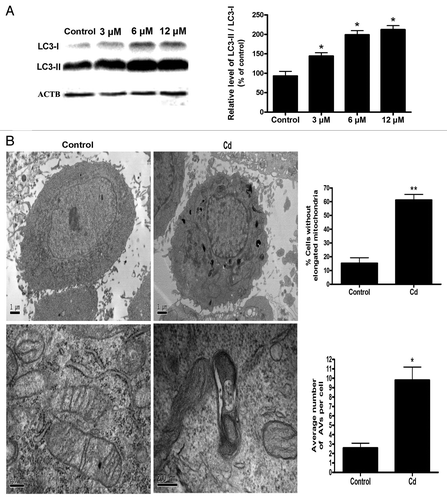
Figure 2A and B. Cd triggers mitophagy in L02 cells. (A) A representative immunoblot and quantification analysis of LC3 protein levels (17 kDa) in L02 cells. ACTB (42 kDa) was the internal standard for protein loading. (B) Electron microscopy revealed an increased number of AVs.

Figure 2C–F. Cd triggers mitophagy in L02 cells. (C) To visualize the mitochondria-containing AP formations, the colocalization of GFP-LC3 with TOMM20 determined in L02 cells. Red: TOMM20, green: GFP-LC3, orange-yellow: Merge. The orange-yellow puncta were counted as mitochondria-containing APs. (D) To visualize the colocalization between mitochondria and autolysosomes, the colocalization of LysoTracker Red with MitoTracker Green in L02 cells was analyzed. Red: LysoTracker Red, green: MitoTracker Green, orange-yellow: Merge. The orange-yellow puncta were counted as mitochondria-containing ALs. (E) Quantification analysis of mitochondria-containing APs. (F) Quantification analysis of mitochondria-containing ALs. A minimum of 50 cells were analyzed for each experiment. The results are expressed as a percentage of control, which was set at 100%. The values are the means ± SEM; *P < 0.05, **P < 0.01 vs. the control group. Arrows indicate the colocalization dots.
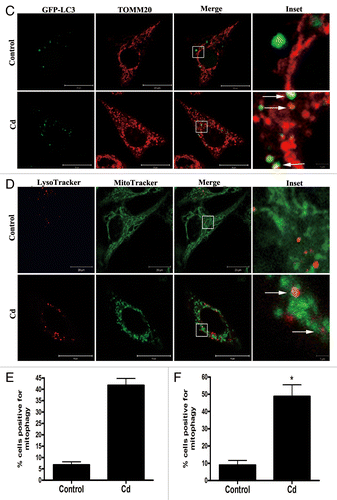
Figure 2C–F. Cd triggers mitophagy in L02 cells. (C) To visualize the mitochondria-containing AP formations, the colocalization of GFP-LC3 with TOMM20 determined in L02 cells. Red: TOMM20, green: GFP-LC3, orange-yellow: Merge. The orange-yellow puncta were counted as mitochondria-containing APs. (D) To visualize the colocalization between mitochondria and autolysosomes, the colocalization of LysoTracker Red with MitoTracker Green in L02 cells was analyzed. Red: LysoTracker Red, green: MitoTracker Green, orange-yellow: Merge. The orange-yellow puncta were counted as mitochondria-containing ALs. (E) Quantification analysis of mitochondria-containing APs. (F) Quantification analysis of mitochondria-containing ALs. A minimum of 50 cells were analyzed for each experiment. The results are expressed as a percentage of control, which was set at 100%. The values are the means ± SEM; *P < 0.05, **P < 0.01 vs. the control group. Arrows indicate the colocalization dots.

Figure 3. Cd does not inhibit autophagic flux in L02 cells. (A) A representative immunoblot and quantification analysis of the SQSTM1 (75 kDa) protein levels in L02 cells. ACTB (42 kDa) was the internal standard for protein loading. (B) The L02 cells were transfected with a GFP-LC3 plasmid and exposed to 12 μM CdCl2 and 10 nM bafilomycin A1 alone or together for 12 h. The formation of GFP-LC3 puncta was examined using confocal microscopy and was quantified. (C) The western blot analyses for the expression of PPARGC1A and TFAM protein. ACTB (42 kDa) was the internal standard for protein loading. The data are representative of 4 independent experiments. The results are expressed as a percentage of control, which was set at 100%. The values are the means ± SEM; *P < 0.05 vs. the control group; #P < 0.05 vs. the CdCl2 group.
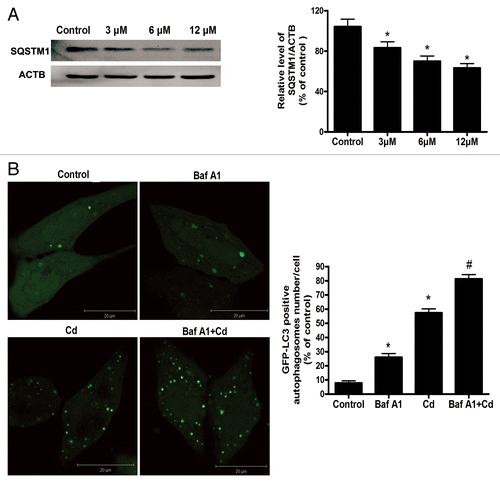
Figure 3. Cd does not inhibit autophagic flux in L02 cells. (A) A representative immunoblot and quantification analysis of the SQSTM1 (75 kDa) protein levels in L02 cells. ACTB (42 kDa) was the internal standard for protein loading. (B) The L02 cells were transfected with a GFP-LC3 plasmid and exposed to 12 μM CdCl2 and 10 nM bafilomycin A1 alone or together for 12 h. The formation of GFP-LC3 puncta was examined using confocal microscopy and was quantified. (C) The western blot analyses for the expression of PPARGC1A and TFAM protein. ACTB (42 kDa) was the internal standard for protein loading. The data are representative of 4 independent experiments. The results are expressed as a percentage of control, which was set at 100%. The values are the means ± SEM; *P < 0.05 vs. the control group; #P < 0.05 vs. the CdCl2 group.

Figure 4A and B.ATG5 siRNA treatment reverses mitochondrial loss by inhibiting mitophagy. (A) A representative immunoblot of ATG5 protein levels (55 kDa) in L02 cells following ATG5 silencing using a commercial vector. ACTB (42 kDa) was the internal standard for protein loading. (B) The colocalization of GFP-LC3 with TOMM20 was determined in L02 cells to visualize the mitochondria-containing AP formations. Red: TOMM20, green: GFP-LC3, orange-yellow: Merge. The orange-yellow puncta were counted as mitochondria-containing APs. A minimum of 50 cells were analyzed for each experiment.
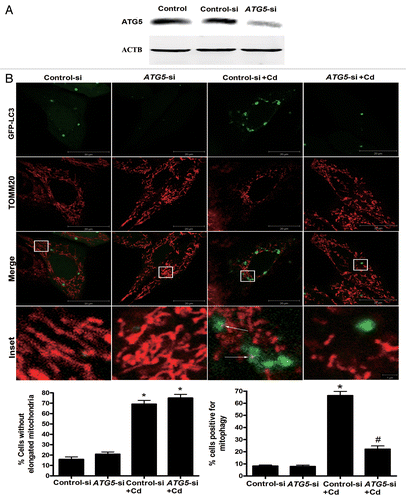
Figure 4A and B.ATG5 siRNA treatment reverses mitochondrial loss by inhibiting mitophagy. (A) A representative immunoblot of ATG5 protein levels (55 kDa) in L02 cells following ATG5 silencing using a commercial vector. ACTB (42 kDa) was the internal standard for protein loading. (B) The colocalization of GFP-LC3 with TOMM20 was determined in L02 cells to visualize the mitochondria-containing AP formations. Red: TOMM20, green: GFP-LC3, orange-yellow: Merge. The orange-yellow puncta were counted as mitochondria-containing APs. A minimum of 50 cells were analyzed for each experiment.

Figure 4C–G.ATG5 siRNA treatment reverses mitochondrial loss by inhibiting mitophagy. (C) A representative immunoblot of COX4I1 (17 kDa) protein levels in L02 cells silenced using a commercial vector. ACTB (42 kDa) was the internal standard for protein loading. (E) Quantitative real-time PCR analysis was applied to detect mtDNA copy number. (D) The mitochondrial mass, (F) ATP concentrations, and (G) cell viability were analyzed using an Infinite™ M200 Microplate Reader. The data are representative of 4 independent experiments. The results were expressed as a percentage of control, which was set at 100%. The values are the means ± SEM; *P < 0.05 vs. the control group; #P < 0.05, ##P < 0.01versus the CdCl2 group. Arrows indicate the colocalization dots.
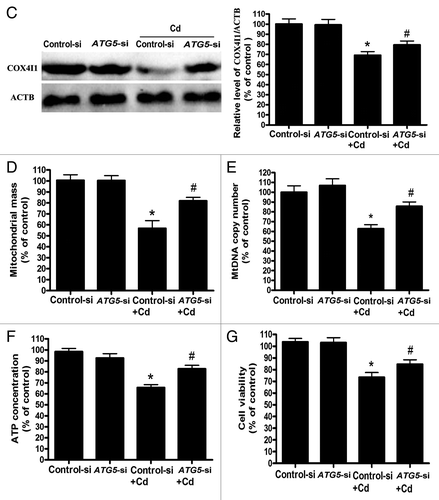
Figure 4C–G.ATG5 siRNA treatment reverses mitochondrial loss by inhibiting mitophagy. (C) A representative immunoblot of COX4I1 (17 kDa) protein levels in L02 cells silenced using a commercial vector. ACTB (42 kDa) was the internal standard for protein loading. (E) Quantitative real-time PCR analysis was applied to detect mtDNA copy number. (D) The mitochondrial mass, (F) ATP concentrations, and (G) cell viability were analyzed using an Infinite™ M200 Microplate Reader. The data are representative of 4 independent experiments. The results were expressed as a percentage of control, which was set at 100%. The values are the means ± SEM; *P < 0.05 vs. the control group; #P < 0.05, ##P < 0.01versus the CdCl2 group. Arrows indicate the colocalization dots.

Figure 5. Cd exposure disrupts mitochondrial morphology in L02 cells. The specific fluorescence probe MitoTracker Red CMXRos (red) was used to detect alterations in mitochondrial morphology. (A and C) After the L02 cells were treated with different doses of CdCl2, representative changes in the mitochondrial morphology were detected using confocal microscopy. (B and D) Representative individual mitochondria were tracked using time-lapse microscopy upon treatment of the L02 cells with 12 μM CdCl2. The data are representative of 3 independent experiments. The results were expressed as a percentage of control, which was set at 100%. The values are the means ± SEM; *P < 0.05; **P < 0.01 vs. the control group.
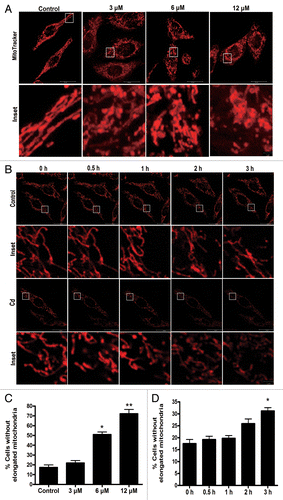
Figure 5. Cd exposure disrupts mitochondrial morphology in L02 cells. The specific fluorescence probe MitoTracker Red CMXRos (red) was used to detect alterations in mitochondrial morphology. (A and C) After the L02 cells were treated with different doses of CdCl2, representative changes in the mitochondrial morphology were detected using confocal microscopy. (B and D) Representative individual mitochondria were tracked using time-lapse microscopy upon treatment of the L02 cells with 12 μM CdCl2. The data are representative of 3 independent experiments. The results were expressed as a percentage of control, which was set at 100%. The values are the means ± SEM; *P < 0.05; **P < 0.01 vs. the control group.
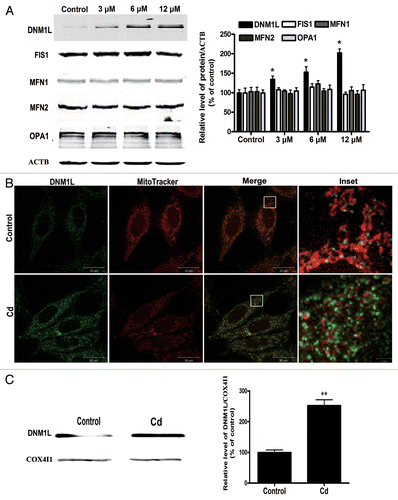
Figure 6. Changes in the levels of mitochondrial fusion/fission proteins and an increase in the mitochondrial localization of DNM1L following Cd treatment. (A) A representative immunoblot and quantification analysis of DNM1L (84 kDa), FIS1 (17 kDa), MFN1 (86 kDa), MFN2 (86 kDa) and OPA1 (112 kDa) protein levels in L02 cells. ACTB (42 kDa) was the internal standard for protein loading. The cells were treated with different doses of CdCl2 for 12 h. (B) Confocal scanning microscope images indicated increased mitochondrial localization of DNM1L following treatment of the L02 cells with CdCl2. Red: MitoTracker Red CMXRos, green: DNM1L. (C) Representative immunoblots and quantification analysis of the DNM1L protein levels (84 kDa) that were observed in the mitochondrial fraction. COX4I1 (17 kDa) was the internal standard for the mitochondrial protein loading. The data are representative of 4 independent experiments. The results were expressed as a percentage of control, which was set at 100%. The values are the means ± SEM; *P < 0.05; **P < 0.01 vs. the control group.

Figure 6. Changes in the levels of mitochondrial fusion/fission proteins and an increase in the mitochondrial localization of DNM1L following Cd treatment. (A) A representative immunoblot and quantification analysis of DNM1L (84 kDa), FIS1 (17 kDa), MFN1 (86 kDa), MFN2 (86 kDa) and OPA1 (112 kDa) protein levels in L02 cells. ACTB (42 kDa) was the internal standard for protein loading. The cells were treated with different doses of CdCl2 for 12 h. (B) Confocal scanning microscope images indicated increased mitochondrial localization of DNM1L following treatment of the L02 cells with CdCl2. Red: MitoTracker Red CMXRos, green: DNM1L. (C) Representative immunoblots and quantification analysis of the DNM1L protein levels (84 kDa) that were observed in the mitochondrial fraction. COX4I1 (17 kDa) was the internal standard for the mitochondrial protein loading. The data are representative of 4 independent experiments. The results were expressed as a percentage of control, which was set at 100%. The values are the means ± SEM; *P < 0.05; **P < 0.01 vs. the control group.

Figure 7. Time-course analysis for the expression of LC3 and DNM1L in Cd-treated L02 cells. (A) A representative immunoblot and quantification analysis of the LC3 protein levels (17 kDa) in L02 cells. (B) A representative immunoblot and quantification analysis of DNM1L protein levels (84 kDa). ACTB (42 kDa) was the internal standard for protein loading. The cells were treated with 12 µM CdCl2 for various periods of time (0, 3, 6, 12, or 24 h). The data are representative of 4 independent experiments. The results are expressed as a percentage of control, which was set at 100%. The values are means ± SEM; *P < 0.05 vs. the control group.
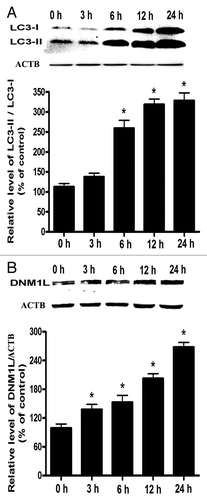
Figure 7. Time-course analysis for the expression of LC3 and DNM1L in Cd-treated L02 cells. (A) A representative immunoblot and quantification analysis of the LC3 protein levels (17 kDa) in L02 cells. (B) A representative immunoblot and quantification analysis of DNM1L protein levels (84 kDa). ACTB (42 kDa) was the internal standard for protein loading. The cells were treated with 12 µM CdCl2 for various periods of time (0, 3, 6, 12, or 24 h). The data are representative of 4 independent experiments. The results are expressed as a percentage of control, which was set at 100%. The values are means ± SEM; *P < 0.05 vs. the control group.

Figure 8A–C.DNM1L siRNA blocks mitochondrial fragmentation and mitophagy in Cd-treated L02 cells. (A) A representative immunoblot of the DNM1L protein levels (84 kDa) in L02 cells in which DNM1L was silenced using a commercial vector. ACTB (42 kDa) was the internal standard for protein loading. (B) After the L02 cells were treated with 12 μM CdCl2 for 12 h, MitoTracker Red CMXRos (red) was used to detect the effects of the DNM1L silencing vehicle (green) on mitochondrial fragmentation. (C) A representative immunoblot of the DNM1L protein levels (84 kDa) in L02 cells in which ATG5 was silenced. ACTB (42 kDa) was the internal standard for protein loading.
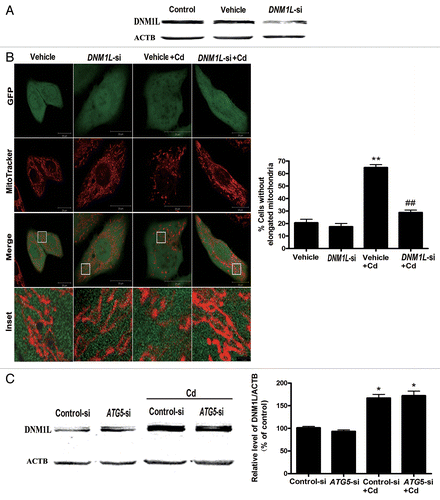
Figure 8A–C.DNM1L siRNA blocks mitochondrial fragmentation and mitophagy in Cd-treated L02 cells. (A) A representative immunoblot of the DNM1L protein levels (84 kDa) in L02 cells in which DNM1L was silenced using a commercial vector. ACTB (42 kDa) was the internal standard for protein loading. (B) After the L02 cells were treated with 12 μM CdCl2 for 12 h, MitoTracker Red CMXRos (red) was used to detect the effects of the DNM1L silencing vehicle (green) on mitochondrial fragmentation. (C) A representative immunoblot of the DNM1L protein levels (84 kDa) in L02 cells in which ATG5 was silenced. ACTB (42 kDa) was the internal standard for protein loading.

Figure 8D–F.DNML1 siRNA blocks mitochondrial fragmentation and mitophagy in Cd-treated L02 cells. (D) Representative immunoblot and quantification analysis of LC3 (17 kDa) levels in DNM1L-RNAi-treated L02 cells following treatment with 12 μM CdCl2 for 12 h. ACTB (42 kDa) was the internal standard for protein loading. (E) To examine the effect of DNM1L reduction on CdCl2-induced mitophagy, L02 cells were cotransfected with an empty/negative control vehicle. Two days following transfection, the cells were treated with 12 μM CdCl2 for 12 h, fixed, and stained with TOMM20 and an anti-LC3 antibody. The number of mitochondria-containing APs was quantified. A minimum of 50 cells were analyzed for each experiment. Red: TOMM20, green: DNM1L, white: LC3. (F) Quantification of mitochondrial mass in DNM1L RNAi-treated L02 cells following treatment with 12 μM CdCl2 for 12 h. The results were obtained from 4 independent experiments. The values are the means ± SEM; *P < 0.05; **P < 0.01 vs. the control group; #P < 0.05; ##P < 0.01 vs. the CdCl2 group. Arrows indicate the colocalization dots.
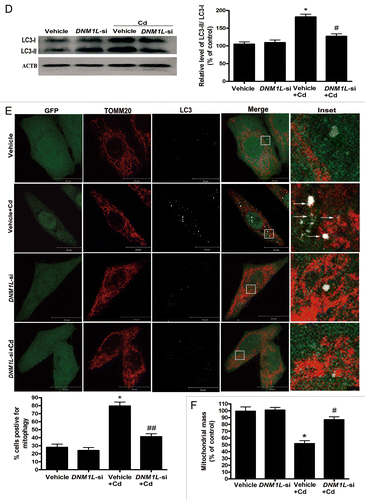
Figure 8D–F.DNML1 siRNA blocks mitochondrial fragmentation and mitophagy in Cd-treated L02 cells. (D) Representative immunoblot and quantification analysis of LC3 (17 kDa) levels in DNM1L-RNAi-treated L02 cells following treatment with 12 μM CdCl2 for 12 h. ACTB (42 kDa) was the internal standard for protein loading. (E) To examine the effect of DNM1L reduction on CdCl2-induced mitophagy, L02 cells were cotransfected with an empty/negative control vehicle. Two days following transfection, the cells were treated with 12 μM CdCl2 for 12 h, fixed, and stained with TOMM20 and an anti-LC3 antibody. The number of mitochondria-containing APs was quantified. A minimum of 50 cells were analyzed for each experiment. Red: TOMM20, green: DNM1L, white: LC3. (F) Quantification of mitochondrial mass in DNM1L RNAi-treated L02 cells following treatment with 12 μM CdCl2 for 12 h. The results were obtained from 4 independent experiments. The values are the means ± SEM; *P < 0.05; **P < 0.01 vs. the control group; #P < 0.05; ##P < 0.01 vs. the CdCl2 group. Arrows indicate the colocalization dots.

Figure 9A–C. Mdivi-1 suppresses Cd-induced mitophagy in vivo. (A) 2D EM analysis of mitochondrial fragmentation in liver tissues. EM micrographs and quantification of elongated (> 2 μm) mitochondria in a control and CdCl2-injured hepatic cell. A minimum of 50 cells from 8 animals were evaluated. (B) Mdivi-1 inhibits the translocation of DNM1L following Cd treatment in vivo. Representative immunoblots and quantification analyses of DNM1L protein levels (86 kDa) in the mitochondrial fraction of liver tissues. COX4I1 (17 kDa) was the internal standard for protein loading. Representative immunoblots and quantification analyses of LC3 (17 kDa) (C) and COX4I1 (17 kDa) protein levels in liver tissues.
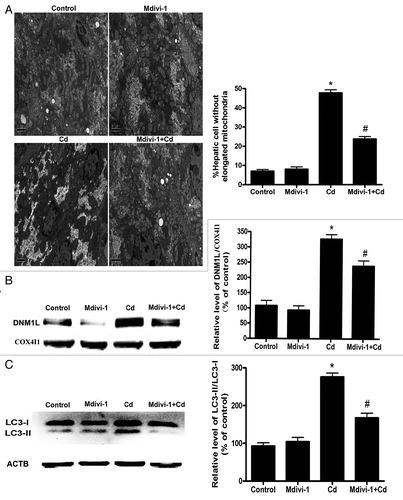
Figure 9A–C. Mdivi-1 suppresses Cd-induced mitophagy in vivo. (A) 2D EM analysis of mitochondrial fragmentation in liver tissues. EM micrographs and quantification of elongated (> 2 μm) mitochondria in a control and CdCl2-injured hepatic cell. A minimum of 50 cells from 8 animals were evaluated. (B) Mdivi-1 inhibits the translocation of DNM1L following Cd treatment in vivo. Representative immunoblots and quantification analyses of DNM1L protein levels (86 kDa) in the mitochondrial fraction of liver tissues. COX4I1 (17 kDa) was the internal standard for protein loading. Representative immunoblots and quantification analyses of LC3 (17 kDa) (C) and COX4I1 (17 kDa) protein levels in liver tissues.

Figure 9D–G. Mdivi-1 suppresses Cd-induced mitophagy in vivo. (D) ACTB (42 kDa) was the internal standard for protein loading. Mdivi-1 inhibits mitochondrial LC3-II expression and increases the levels of mitochondrial SQSTM1. Representative immunoblots and quantification analyses of LC3 (17 kDa) (E) and SQSTM1 (75 kDa) protein levels (F) in the mitochondrial fraction of liver tissues. COX4I1 (17 kDa) was the internal standard for protein loading. (G) The ATP concentrations in the mouse liver were determined using an ATP Determination Kit. The ATP levels were expressed as a percentage of control, which was set at 100%. The values are the means ± SEM, *P < 0.05 vs. the control group; #P < 0.05 vs. the CdCl2 group.
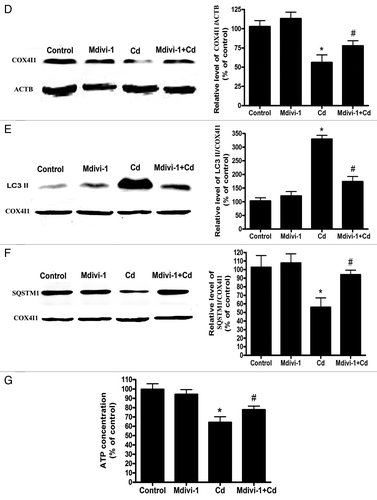
Figure 9D–G. Mdivi-1 suppresses Cd-induced mitophagy in vivo. (D) ACTB (42 kDa) was the internal standard for protein loading. Mdivi-1 inhibits mitochondrial LC3-II expression and increases the levels of mitochondrial SQSTM1. Representative immunoblots and quantification analyses of LC3 (17 kDa) (E) and SQSTM1 (75 kDa) protein levels (F) in the mitochondrial fraction of liver tissues. COX4I1 (17 kDa) was the internal standard for protein loading. (G) The ATP concentrations in the mouse liver were determined using an ATP Determination Kit. The ATP levels were expressed as a percentage of control, which was set at 100%. The values are the means ± SEM, *P < 0.05 vs. the control group; #P < 0.05 vs. the CdCl2 group.
Supplemental material

Additional material

Download Zip (366.7 KB)