Figures & data
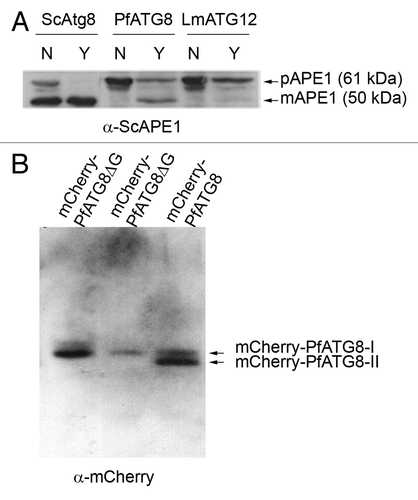
Figure 1. PfATG8 complements a Saccharomyces cerevisiae atg8-deficient mutant and is lipidated in Plasmodium. (A) Expression of S. cerevisiae Atg8 (ScAtg8), P. falciparum ATG8 (PfATG8) and Leishmania major ATG12 (LmATG12) in Scatg8∆. Protein extracts were analyzed for the presence of precursor (pAPE1) or mature (mAPE1) vacuolar aminopeptidase by western blotting using anti-APE1 antiserum. N = autophagy not induced, Y = autophagy induced. (B) Extracts of transgenic P. falciparum D10 parasites expressing mCherry-PfATG8∆G (20 µg and 10 µg, respectively) or full-length mCherry-PfATG8 (20 µg) were separated on 6 M urea 15% SDS-PAGE, blotted and probed with anti-mCherry antibody.

Figure 2. Amino acid deprivation induces fusion between PfRAB7-positive and PfATG8-positive compartments. (A) Morphological changes observed in P. falciparum-infected erythrocytes in Giemsa stained thin smears 4 h and 9 h after amino acid-deprivation [Zeiss Axio Observer.Z1 microscope with CoolSNAP HQ2 Camera, 100× phase contrast objective (Photometrics)]. (B) Association of PfRAB7 and PfATG8 under normal or amino acid-deprivation conditions using IFA. The distribution of PfRAB7 (red: excitation: 530 to 560 nm and emission 572 to 647 nm; anti-PfRAB7 peptide antibody) and PfATG8 (green: excitation: 450 to 490 nm and emission 500 to 550 nm; anti-PfATG8 peptide antibody) is shown. Nuclei are stained with DAPI (blue: excitation: 340 to 380 nm and emission 450 to 490 nm). The association of PfRAB7 and PfATG8 is shown in white (merge). The images were obtained using a Leica DMI 6000 microscope with MicroMAX-1300Y/HS camera (Princeton Instruments). The Pearson’s coefficient (r) represents the degree of colocalization between PfRAB7 and PfATG8 in the individual images. FV: food vacuole. (C) Volumetric 3D-reconstruction of IFA images using Imaris (Bitplane) corresponding to the Z-stacks taken for the cell in the lowest panel of (B) (r = 0.72) (Leica DMI 6000 microscope with MicroMAX-1300Y/HS camera). The association between PfRAB7 (red) and PfATG8 (green) is shown in white. Nuclei are stained with DAPI (blue). Scale bar: 1 µm.
![Figure 2. Amino acid deprivation induces fusion between PfRAB7-positive and PfATG8-positive compartments. (A) Morphological changes observed in P. falciparum-infected erythrocytes in Giemsa stained thin smears 4 h and 9 h after amino acid-deprivation [Zeiss Axio Observer.Z1 microscope with CoolSNAP HQ2 Camera, 100× phase contrast objective (Photometrics)]. (B) Association of PfRAB7 and PfATG8 under normal or amino acid-deprivation conditions using IFA. The distribution of PfRAB7 (red: excitation: 530 to 560 nm and emission 572 to 647 nm; anti-PfRAB7 peptide antibody) and PfATG8 (green: excitation: 450 to 490 nm and emission 500 to 550 nm; anti-PfATG8 peptide antibody) is shown. Nuclei are stained with DAPI (blue: excitation: 340 to 380 nm and emission 450 to 490 nm). The association of PfRAB7 and PfATG8 is shown in white (merge). The images were obtained using a Leica DMI 6000 microscope with MicroMAX-1300Y/HS camera (Princeton Instruments). The Pearson’s coefficient (r) represents the degree of colocalization between PfRAB7 and PfATG8 in the individual images. FV: food vacuole. (C) Volumetric 3D-reconstruction of IFA images using Imaris (Bitplane) corresponding to the Z-stacks taken for the cell in the lowest panel of (B) (r = 0.72) (Leica DMI 6000 microscope with MicroMAX-1300Y/HS camera). The association between PfRAB7 (red) and PfATG8 (green) is shown in white. Nuclei are stained with DAPI (blue). Scale bar: 1 µm.](/cms/asset/4dc9840a-9349-4e5c-a95d-41affe47d0fd/kaup_a_10925832_f0002.gif)
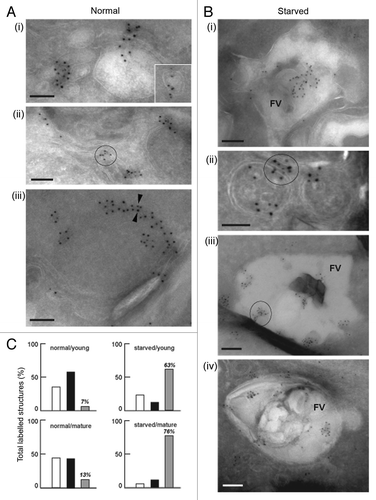
Figure 3. Immuno-electron microscopy localization of PfATG8 and PfRAB7. (A and B) Immunogold staining of P. falciparum under normal growth conditions and under conditions of amino acid-deprivation (starved) reveals the subcellular localization of PfATG8 (10-nm gold particles; A iii) and PfRAB7 (5-nm gold particles, A iii). (A) PfATG8 and PfRAB7 decorate vesicles (i and insert) and membranous tubules (ii) in the cytoplasm. On some occasions, PfATG8 and PfRAB7 occurred at the periphery of double-membrane-bound organelles (iii, arrowheads). Scale bars: 100 nm. (B) PfATG8 and PfRAB7 associated with large structures corresponding to the food vacuole (FV; i). Costaining of PfATG8 and PfRAB7 is also visible on small double-membrane-bound structures (ii), or very large FV vesicles (iii and iv). Scale bars: 100 nm. (C) Quantitative data to measure the distribution of PfATG8 and PfRAB7 on subcellular structures. For each condition corresponding to normal medium/young FV, normal medium/mature FV, starvation medium/young FV, or starvation medium/mature FV, 35 to 55 parasites have been examined to enumerate the structures containing PfRAB7 alone (white histograms), PfATG8 alone (black histograms) or PfRAB7 and PfATG8 conjointly (gray histograms). Values are expressed in % of total labeled structures for each separate category.

Figure 4. In vivo association between GFP-PfRAB7 and GFP-PfATG8 and acidic compartments. Distribution of GFP-PfRAB7 (A) or GFP-PfATG8 (B) and acidic compartments revealed in red with LysoTracker Red-DND99 is observed under normal and starvation conditions using live cell microscopy [Leica DMI 6000 microscope with MicroMAX-1300Y/HS camera (Princeton Instruments)]. The association of GFP-PfRAB7 and acidic compartments is shown in the merged image (yellow). Comparisons are between parasites at similar stages of development. The Pearson’s coefficient (r) represents the degree of colocalization in the individual images. FV; Food vacuole.
![Figure 4. In vivo association between GFP-PfRAB7 and GFP-PfATG8 and acidic compartments. Distribution of GFP-PfRAB7 (A) or GFP-PfATG8 (B) and acidic compartments revealed in red with LysoTracker Red-DND99 is observed under normal and starvation conditions using live cell microscopy [Leica DMI 6000 microscope with MicroMAX-1300Y/HS camera (Princeton Instruments)]. The association of GFP-PfRAB7 and acidic compartments is shown in the merged image (yellow). Comparisons are between parasites at similar stages of development. The Pearson’s coefficient (r) represents the degree of colocalization in the individual images. FV; Food vacuole.](/cms/asset/b6599b2d-25dd-4c15-8c65-1e081fc7facd/kaup_a_10925832_f0004.gif)
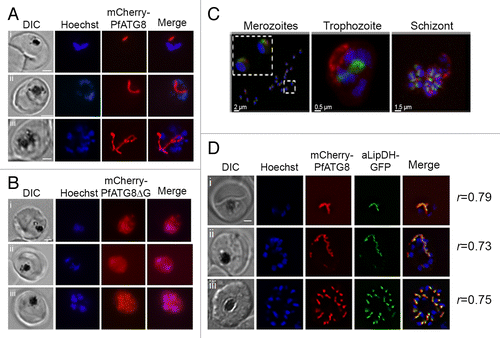
Figure 5. Localization of mCherry-PfATG8 and mCherry-PfATG8∆G. (A) Transgenic mCherry-PfATG8-expressing lines were treated with Hoechst 33258 to stain the nuclei (blue: excitation 365 nm and emission 445 nm) and analyzed by live cell fluorescent light microscopy using an- AxioSkope Mot Plus epifluorescence microscope (Zeiss) with a CCD camera (Hamamatsu) analyzing the distribution of mCherry-PfATG8 (red: excitation 550 and emission 605 nm) which localized to distinct subcellular structures in trophozoite (i and ii), schizont (iii), stage parasites. Images were acquired using OpenLab (Perkin Elmer) and were processed with Image J (NIH) and Photoshop. Scale bar: 2 µm. (B) Transgenic P. falciparum expressing mCherry-PfATG8∆G (red) were stained with Hoechst 33528 (blue) and analyzed as described in (A). Images of trophozoite (i and ii) and schizont (iii) stage parasites are shown. Scale bar: 2 µm. (C) Volumetric 3D-reconstruction of GFP-PfATG8 in vivo (green: excitation 475 to 495 nm and emission 510 to 530 nm) and MitoTracker Red CMXRos (red: excitation548 to 572 nm and emission 590 to 624 nm) in P. falciparum merozoites, trophozoite and schizont using a Zeiss Axio Observer.Z1 microscope with CoolSNAP HQ2 Camera (Photometrics). Nuclei are stained with DAPI (blue: excitation: 381 to 393 nm and emission 420 to 460 nm). Inset in left image shows 2 merozoites on a greater scale. (D) Transgenic P. falciparum expressing both mCherry-PfATG8 and aLipDH-GFP were counterstained with Hoechst 33258 (blue) and analyzed by live cell fluorescent light microscopy using a Delta Vision Core deconvolution microscope (Applied Precision, Inc.) using GFP/FITC filters (excitation 500 nm, emission 560 nm), mCherry filters (excitation 560 nm, emission 630 nm) and DAPI filters (excitation 325 nm, emission 460 nm). Trophozoite (i), early schizont (ii), and late schizont (iii) stages are shown. The Pearson’s coefficients (r) shown next to each image represent the degree of colocalization of mCherry-PfATG8 and aLipDH-GFP in individual images. Scale bar: 2 µm.

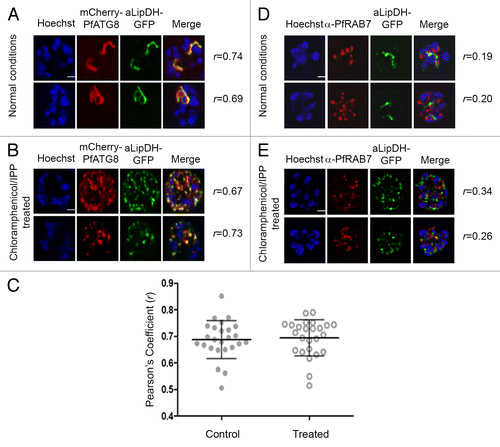
Figure 6. PfATG8, but not PfRAB7, colocalizes with apicoplast-targeted vesicles and apicoplast remnants. (A and B) P. falciparum expressing both mCherry-PfATG8 and aLipDH-GFP were treated with chloramphenicol to chemically disrupt the formation of the apicoplast, and IPP added to the culture medium to maintain viability of the parasites. DMSO control (A) and chloramphenicol treated (B) infected erythrocytes were counterstained with Hoechst 33258. The Pearson’s coefficients (r) show the degree of colocalization in each individual image. (C) Pearson’s coefficient (r) values for parasites coexpressing mCherry-PfATG8 and aLipDH-GFP, either untreated (Control), or treated with chloramphenicol and IPP (Treated). Individual points indicate the r value determined for each parasite analyzed. (D and E) Transgenic parasites expressing aLipDH-GFP were treated as above. Immunofluorescence analyses of untreated controls (D) or chloramphenicol/IPP treated (E) and were performed using anti-PfRAB7 antibodies (red). Hoechst 33258 (blue) was used to stain the nuclei. Scale bar: 2 µm. In all panels, parasites were analyzed using a Delta Vision Core deconvolution microscope (Applied Precision, Inc.) using a 100× objective with the mCherry filter (excitation 560 nm, emission 630 nm) and DAPI filter (excitation 325 nm, emission 460 nm) as indicated. Live cell microscopy was limited to 30 min per sample.
