3,319
Views
55
CrossRef citations to date
0
Altmetric
Translational Research Paper

Autophagic flux and oxidative capacity of skeletal muscles during acute starvation

, , , , , , , , & show all
Pages 1604-1620 | Received 14 Nov 2012, Accepted 29 Jul 2013, Published online: 15 Aug 2013

Figures & data

Figure 1. mRNA expression of various autophagy-related genes in the diaphragm (DIA), soleus (SOL), tibialis anterior (TA), and gastrocnemius-plantaris (GP) muscles of control mice. Values (means ± SEM) are expressed as fold change relative to DIA. *P < 0.05, as compared with DIA. TUBB: β-TUBULIN. n = 6 per group.
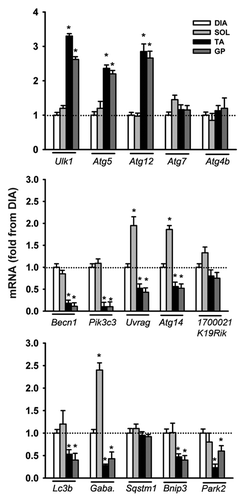
Figure 1. mRNA expression of various autophagy-related genes in the diaphragm (DIA), soleus (SOL), tibialis anterior (TA), and gastrocnemius-plantaris (GP) muscles of control mice. Values (means ± SEM) are expressed as fold change relative to DIA. *P < 0.05, as compared with DIA. TUBB: β-TUBULIN. n = 6 per group.

Figure 2. Protein expression of various autophagy-related genes. (A–C) Representative immunoblots of various autophagy-related genes in DIA, TA, SOL, extensor digitorum longus (EDL), and GP muscles of control mice. (B–D) Protein optical densities of various autophagy-related genes in DIA, TA, SOL, and GP muscles of control mice. Values (means ± SEM) are expressed as fold change relative to DIA. *P < 0.05, as compared with DIA. ACTB: β-ACTIN. n = 6 per group.
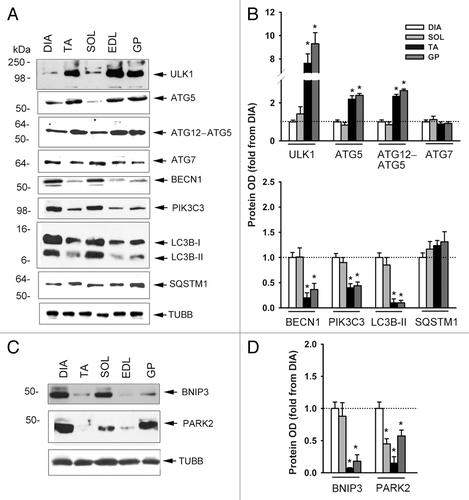
Figure 2. Protein expression of various autophagy-related genes. (A–C) Representative immunoblots of various autophagy-related genes in DIA, TA, SOL, extensor digitorum longus (EDL), and GP muscles of control mice. (B–D) Protein optical densities of various autophagy-related genes in DIA, TA, SOL, and GP muscles of control mice. Values (means ± SEM) are expressed as fold change relative to DIA. *P < 0.05, as compared with DIA. ACTB: β-ACTIN. n = 6 per group.

Figure 3. Autophagic flux measurements in control mice. (A and B) Representative immunoblots of LC3B and SQSTM1 proteins in DIA, TA, SOL, and GP muscles of mice in the vehicle, leupeptin and colchicine injection subgroups. Note relative increases in response to leupeptin and colchicine. (C) LC3B-II and SQSTM1 autophagic fluxes in DIA, TA, SOL, and GP muscles of control mice measured with the leupeptin and colchicine methods. *P < 0.05, as compared with DIA. n = 6 per group.
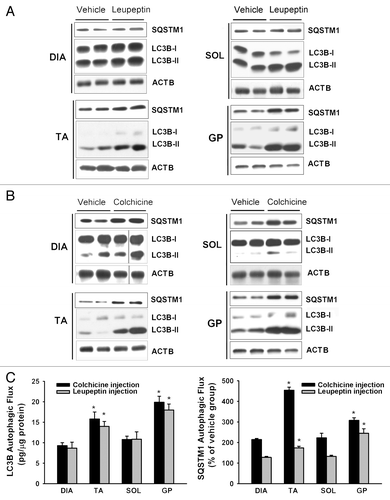
Figure 3. Autophagic flux measurements in control mice. (A and B) Representative immunoblots of LC3B and SQSTM1 proteins in DIA, TA, SOL, and GP muscles of mice in the vehicle, leupeptin and colchicine injection subgroups. Note relative increases in response to leupeptin and colchicine. (C) LC3B-II and SQSTM1 autophagic fluxes in DIA, TA, SOL, and GP muscles of control mice measured with the leupeptin and colchicine methods. *P < 0.05, as compared with DIA. n = 6 per group.

Figure 4. Detection of autophagosomes using electron microscopy. (A, D, and E) Representative electron micrographs of autophagosomes (white arrows) in DIA, TA, and SOL muscles, respectively, of acutely starved mice. Mito refers to the nucleus and mitochondria, respectively. (B) Representative electron micrographs of normal sub-sarcolemmal and intermyofibrillar mitochondria in DIA of control mouse. (C) Representative electron micrograph of an autophagosome in TA of a control mouse. (F) Autophagosome numbers in DIA, TA, and SOL muscles of control and acutely starved mice. Values (means ± SEM) are expressed as the number of autophagosomes per field. n = 4 per group. *P < 0.05, as compared with DIA. #P < 0.05 compared with control.
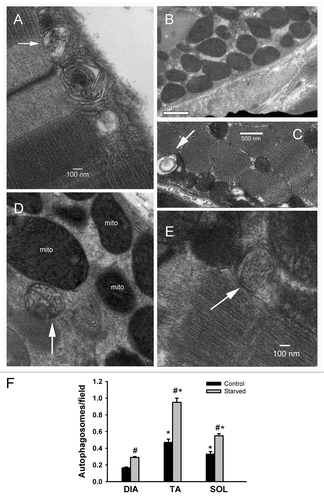
Figure 4. Detection of autophagosomes using electron microscopy. (A, D, and E) Representative electron micrographs of autophagosomes (white arrows) in DIA, TA, and SOL muscles, respectively, of acutely starved mice. Mito refers to the nucleus and mitochondria, respectively. (B) Representative electron micrographs of normal sub-sarcolemmal and intermyofibrillar mitochondria in DIA of control mouse. (C) Representative electron micrograph of an autophagosome in TA of a control mouse. (F) Autophagosome numbers in DIA, TA, and SOL muscles of control and acutely starved mice. Values (means ± SEM) are expressed as the number of autophagosomes per field. n = 4 per group. *P < 0.05, as compared with DIA. #P < 0.05 compared with control.

Figure 5. mRNA expression of various autophagy-related genes in DIA, TA, SOL, and GP muscles of acutely starved mice. Gaba. refers to Gabarapl1. Values (means ± SEM) are expressed as fold change relative to control group. #P < 0.05, as compared with control. n = 6 per group.
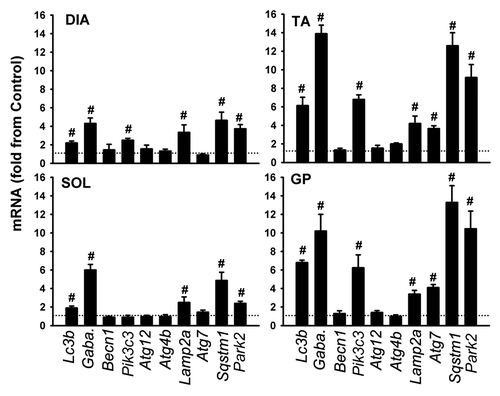
Figure 5. mRNA expression of various autophagy-related genes in DIA, TA, SOL, and GP muscles of acutely starved mice. Gaba. refers to Gabarapl1. Values (means ± SEM) are expressed as fold change relative to control group. #P < 0.05, as compared with control. n = 6 per group.

Figure 6. LC3B lipidation and autophagic flux measurements in response to starvation. (A) Representative immunoblots of LC3B protein in DIA, TA, SOL, EDL, and GP muscles of control and acutely (24 h) starved mice. Muscle samples were loaded on the same gel. (B) Representative immunoblots of LC3B protein in DIA, TA, and SOL muscles of control and acutely starved mice. Samples were loaded on separate gels. (C and D) Protein optical densities of LC3B-II and LC3B-II/LC3B-I ratio in DIA, TA, SOL, EDL, and GP muscles of acutely (24 h) starved mice. Values (means ± SEM) are expressed as fold change relative to control group. *P < 0.05, as compared with DIA. #P < 0.05, as compared with control. n = 6 per group. (E) Representative immunoblots of LC3B protein in DIA, TA, and SOL muscles of control mice and mice exposed to 6 h and 48 h of starvation. (F) Protein optical densities of LC3B-II protein in DIA, TA, and SOL muscles obtained from mice exposed to 6 h and 48 h of starvation. Values (means ± SEM) are expressed as fold change relative to control group. n = 4 per group. Symbols are as described above. (G) Representative immunoblots of LC3B in DIA, TA, and SOL muscles of acutely starved mice by vehicle and leupeptin subgroup. Note significant increase in LC3B-II in response to leupeptin. (H) LC3B-II autophagic flux values measured in DIA, TA, SOL, and GP muscles of starved mice in response to leupeptin injection. *P < 0.05, as compared with DIA. n = 6 per group.
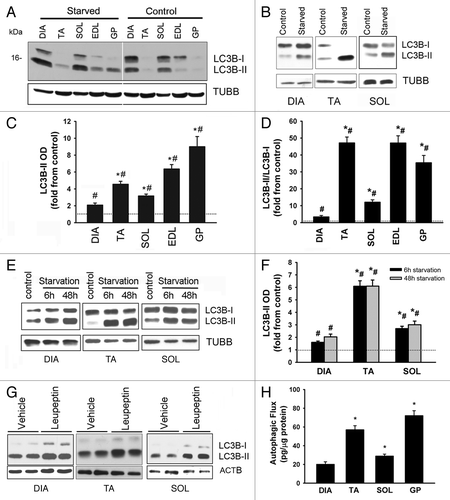
Figure 6. LC3B lipidation and autophagic flux measurements in response to starvation. (A) Representative immunoblots of LC3B protein in DIA, TA, SOL, EDL, and GP muscles of control and acutely (24 h) starved mice. Muscle samples were loaded on the same gel. (B) Representative immunoblots of LC3B protein in DIA, TA, and SOL muscles of control and acutely starved mice. Samples were loaded on separate gels. (C and D) Protein optical densities of LC3B-II and LC3B-II/LC3B-I ratio in DIA, TA, SOL, EDL, and GP muscles of acutely (24 h) starved mice. Values (means ± SEM) are expressed as fold change relative to control group. *P < 0.05, as compared with DIA. #P < 0.05, as compared with control. n = 6 per group. (E) Representative immunoblots of LC3B protein in DIA, TA, and SOL muscles of control mice and mice exposed to 6 h and 48 h of starvation. (F) Protein optical densities of LC3B-II protein in DIA, TA, and SOL muscles obtained from mice exposed to 6 h and 48 h of starvation. Values (means ± SEM) are expressed as fold change relative to control group. n = 4 per group. Symbols are as described above. (G) Representative immunoblots of LC3B in DIA, TA, and SOL muscles of acutely starved mice by vehicle and leupeptin subgroup. Note significant increase in LC3B-II in response to leupeptin. (H) LC3B-II autophagic flux values measured in DIA, TA, SOL, and GP muscles of starved mice in response to leupeptin injection. *P < 0.05, as compared with DIA. n = 6 per group.

Figure 7. Relationship between LC3B-II autophagic flux and citrate synthase activity in DIA, TA, SOL, and GP muscles of control and acutely starved mice.
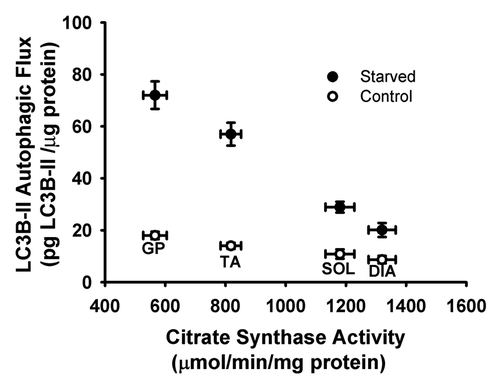
Figure 7. Relationship between LC3B-II autophagic flux and citrate synthase activity in DIA, TA, SOL, and GP muscles of control and acutely starved mice.

Figure 8. Activation of AMPK, AKT, and MTORC1 pathways. (A) Representative immunoblots of total and phosphorylated (Thr172) AMPK in DIA, TA, and SOL muscles of control and acutely starved mice. (B) Protein optical densities of total and phosphorylated AMPK in DIA, TA, and SOL muscles of control and acutely starved mice. Values (means ± SEM) are expressed as fold change relative to control group. *P < 0.05, as compared with DIA. #P < 0.05, as compared with control. n = 6 per group. (C) Representative immunoblots of total and phosphorylated (Ser473) AKT in DIA, TA, and SOL muscles of control and acutely starved mice. (D) Protein optical densities of total and phosphorylated (Ser473) AKT in DIA, TA, and SOL muscles of control and acutely starved mice. Values (means ± SEM) are expressed as fold change relative to control group. #P < 0.05, as compared with control. n = 6 per group. (E) Representative immunoblots of total and phosphorylated (Thr389) ribosomal protein S6 kinase B1 (RPS6KB1) in DIA, TA, and SOL muscles of control and acutely starved mice. (F) Protein optical densities of total and phosphorylated (Thr389) RPS6KB1 in DIA, TA, and SOL muscles of control and acutely starved mice. Values (means ± SEM) are expressed as fold change relative to control groups. #P < 0.05, as compared with control. n = 6 per group. (G) Representative immunoblots of total and phosphorylated (Ser235/236) ribosomal protein S6 (RPS6) in DIA, TA, and SOL muscles of control and acutely starved mice. (H) Protein optical densities of total and phosphorylated (Ser235/236) RPS6 in DIA, TA, and SOL muscles of control and acutely starved mice. Values (means ± SEM) are expressed as fold change relative to control groups. #P < 0.05, as compared with control. n = 6 per group.
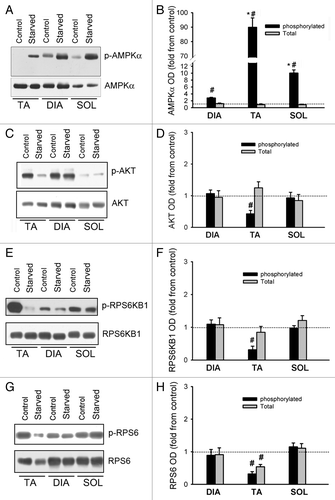
Figure 8. Activation of AMPK, AKT, and MTORC1 pathways. (A) Representative immunoblots of total and phosphorylated (Thr172) AMPK in DIA, TA, and SOL muscles of control and acutely starved mice. (B) Protein optical densities of total and phosphorylated AMPK in DIA, TA, and SOL muscles of control and acutely starved mice. Values (means ± SEM) are expressed as fold change relative to control group. *P < 0.05, as compared with DIA. #P < 0.05, as compared with control. n = 6 per group. (C) Representative immunoblots of total and phosphorylated (Ser473) AKT in DIA, TA, and SOL muscles of control and acutely starved mice. (D) Protein optical densities of total and phosphorylated (Ser473) AKT in DIA, TA, and SOL muscles of control and acutely starved mice. Values (means ± SEM) are expressed as fold change relative to control group. #P < 0.05, as compared with control. n = 6 per group. (E) Representative immunoblots of total and phosphorylated (Thr389) ribosomal protein S6 kinase B1 (RPS6KB1) in DIA, TA, and SOL muscles of control and acutely starved mice. (F) Protein optical densities of total and phosphorylated (Thr389) RPS6KB1 in DIA, TA, and SOL muscles of control and acutely starved mice. Values (means ± SEM) are expressed as fold change relative to control groups. #P < 0.05, as compared with control. n = 6 per group. (G) Representative immunoblots of total and phosphorylated (Ser235/236) ribosomal protein S6 (RPS6) in DIA, TA, and SOL muscles of control and acutely starved mice. (H) Protein optical densities of total and phosphorylated (Ser235/236) RPS6 in DIA, TA, and SOL muscles of control and acutely starved mice. Values (means ± SEM) are expressed as fold change relative to control groups. #P < 0.05, as compared with control. n = 6 per group.

Figure 9. ULK1 expression and phosphorylation in response to starvation. (A, D, and G) Representative immunoblots of total and phosphorylated (Ser555) ULK1 in TA, DIA, and SOL muscles of control animals and those who underwent starvation for 6, 24, or 48 h. (B, E, and H) Protein optical densities of total and phosphorylated ULK1 in TA, DIA, and SOL muscles of control and acutely starved mice. Values (means ± SEM) are expressed as fold change relative to control group. #P < 0.05, as compared with control. n = 4 per group. (C, F, and I) Ratios of optical densities of phosphorylated and total ULK1 proteins in TA, DIA, and SOL muscles of control and acutely starved mice. Values are means ± SEM #P < 0.05, as compared with control. n = 4 per group.
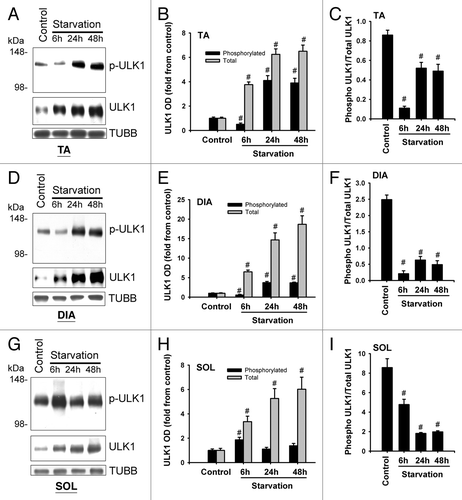
Figure 9. ULK1 expression and phosphorylation in response to starvation. (A, D, and G) Representative immunoblots of total and phosphorylated (Ser555) ULK1 in TA, DIA, and SOL muscles of control animals and those who underwent starvation for 6, 24, or 48 h. (B, E, and H) Protein optical densities of total and phosphorylated ULK1 in TA, DIA, and SOL muscles of control and acutely starved mice. Values (means ± SEM) are expressed as fold change relative to control group. #P < 0.05, as compared with control. n = 4 per group. (C, F, and I) Ratios of optical densities of phosphorylated and total ULK1 proteins in TA, DIA, and SOL muscles of control and acutely starved mice. Values are means ± SEM #P < 0.05, as compared with control. n = 4 per group.

Figure 10. mRNA expression of Foxo1, Foxo3, and Foxo4 transcription factors in DIA, TA, and SOL muscles of control and acutely starved mice. Values (means ± SEM) are expressed as copies per 104 copies of 18S. *P < 0.05, as compared with DIA. #P < 0.05, as compared with control. n = 6 per group.
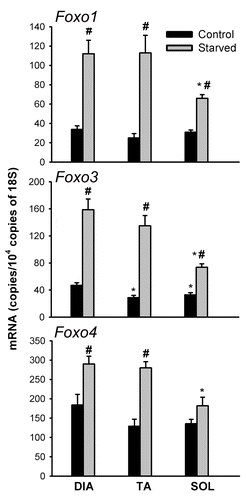
Figure 10. mRNA expression of Foxo1, Foxo3, and Foxo4 transcription factors in DIA, TA, and SOL muscles of control and acutely starved mice. Values (means ± SEM) are expressed as copies per 104 copies of 18S. *P < 0.05, as compared with DIA. #P < 0.05, as compared with control. n = 6 per group.

Figure 11. Expression and phosphorylation of FOXO1 and FOXO3 in response to starvation. (A) Representative immunoblots of total and phosphorylated (Ser256) FOXO1 in DIA, TA, and SOL muscles of control and acutely starved mice. (B) Protein optical densities of total and phosphorylated (Ser256) FOXO1 in DIA, TA, and SOL muscles of control and acutely starved mice. Values (means ± SEM) are expressed as fold change relative to control group. #P < 0.05, as compared with control. n = 6 per group. (C) Representative immunoblots of total and phosphorylated (Ser253) FOXO3 in DIA, TA, and SOL muscles of control and acutely starved mice. (D) Protein optical densities of total and phosphorylated (Ser253) FOXO3 in DIA, TA, and SOL muscles of control and acutely starved mice. Values (means ± SEM) are expressed as fold change relative to control group. #P < 0.05, as compared with control. n = 6 per group. (E) mRNA expression of three targets of FOXO transcriptional activities (Bnip3, Bnip3l, and Fbxo32) in DIA, TA, and SOL of acutely starved mice. Values (means ± SEM) are expressed as fold change relative to control group. #P < 0.05, as compared with control. n = 6 per group.
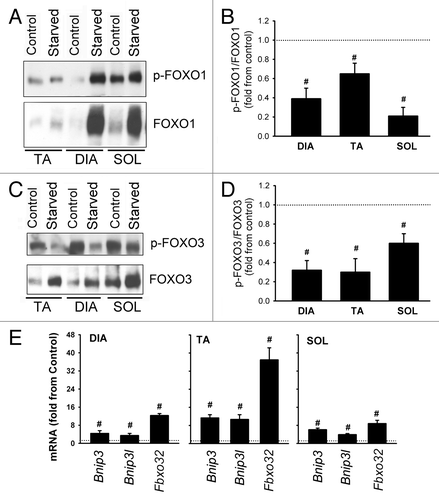
Figure 11. Expression and phosphorylation of FOXO1 and FOXO3 in response to starvation. (A) Representative immunoblots of total and phosphorylated (Ser256) FOXO1 in DIA, TA, and SOL muscles of control and acutely starved mice. (B) Protein optical densities of total and phosphorylated (Ser256) FOXO1 in DIA, TA, and SOL muscles of control and acutely starved mice. Values (means ± SEM) are expressed as fold change relative to control group. #P < 0.05, as compared with control. n = 6 per group. (C) Representative immunoblots of total and phosphorylated (Ser253) FOXO3 in DIA, TA, and SOL muscles of control and acutely starved mice. (D) Protein optical densities of total and phosphorylated (Ser253) FOXO3 in DIA, TA, and SOL muscles of control and acutely starved mice. Values (means ± SEM) are expressed as fold change relative to control group. #P < 0.05, as compared with control. n = 6 per group. (E) mRNA expression of three targets of FOXO transcriptional activities (Bnip3, Bnip3l, and Fbxo32) in DIA, TA, and SOL of acutely starved mice. Values (means ± SEM) are expressed as fold change relative to control group. #P < 0.05, as compared with control. n = 6 per group.
Supplemental material

Additional material

Download Zip (195.1 KB)

Reprints and Corporate Permissions

Please note: Selecting permissions does not provide access to the full text of the article, please see our help page How do I view content?

To request a reprint or corporate permissions for this article, please click on the relevant link below:

Academic Permissions

Please note: Selecting permissions does not provide access to the full text of the article, please see our help page How do I view content?

Obtain permissions instantly via Rightslink by clicking on the button below:

If you are unable to obtain permissions via Rightslink, please complete and submit this Permissions form. For more information, please visit our Permissions help page.